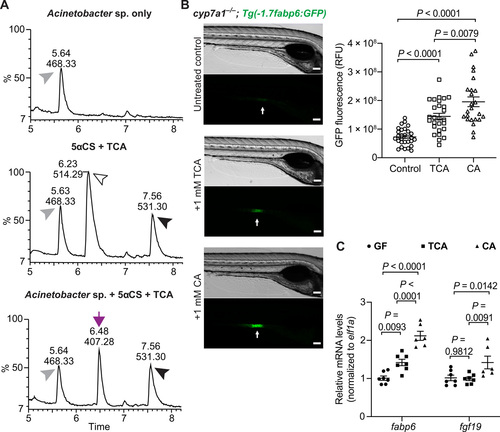
A zebrafish gut bacterium modifies primary bile acid producing a metabolite that augments Fxr signaling in zebrafish.(A) LC-MS chromatographs of medium only control (top), bile salts only control (middle), and Acinetobacter sp. ZOR0008 culture supplemented with bile salts (bottom) under aerobic conditions. The arrowheads indicate the supplemented bile salts and internal control: black arrowhead, 5αCS; white arrowhead, TCA; gray arrowhead, internal standard D4-GCA. The purple arrow indicates that the liberated CA resulted from bacterial deconjugation of TCA. Results from other bacterial strains are shown in fig. S4C. (B) Imaging and quantification of GFP fluorescence of the ileal region of 7-dpf Tg(-1.7fabp6:GFP) cyp7a1−/− larvae that were untreated or treated with either 1 mM TCA or CA for 4 days. The zebrafish ileal region is indicated by arrows. Scale bars, 100 μm. (C) qRT-PCR comparing the expression of Fxr target genes in 7-dpf wt germ-free larvae that were untreated or treated with either 1 mM TCA or CA for 4 days. The results are represented as relative expression levels normalized to the housekeeping gene ef1a (mean ± SEM). Statistical significance was calculated by one-way (B) and two-way (C) analysis of variance (ANOVA) with Tukey’s multiple comparisons test. Representative data from at least three independent experiments are shown.
|
