
Fig. 3
- ID
- ZDB-FIG-220415-7
- Publication
- Wen et al., 2021 - Fxr signaling and microbial metabolism of bile salts in the zebrafish intestine
- Other Figures
- All Figure Page
- Back to All Figure Page
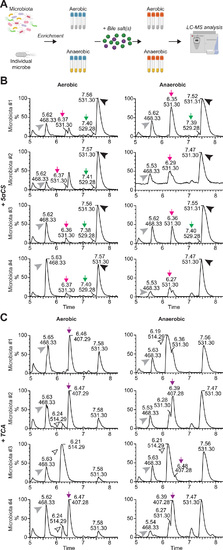
Microbiota modulate bile salt diversity in zebrafish.(A) Schematic diagram of the in vitro bile salt metabolism assay. Complex microbiota or individual bacterial strains were enriched in modified tryptic soy broth (TSB) media under both aerobic and anaerobic conditions, and then incubated with 50 μM bile salts of interest, after which the total bile salts were extracted from individual bacterial cultures and subjected to LC-MS to identify modification of the supplemented bile salts. The diagram is created with BioRender.com. (B and C) LC-MS chromatographs of bile salt metabolites extracted from enriched zebrafish microbiota cultures supplemented with 50 μM 5αCS (B) or TCA (C) under aerobic (left) or anaerobic (right) conditions. The arrowheads indicate the supplemented bile salts and internal control: black arrowhead, 5αCS; white arrowhead, TCA; gray arrowhead, internal standard D4-glycocholic acid (D4-GCA). The arrows indicate that bile salt metabolites resulted from microbial modification of the supplemented bile salts: green arrow, dehydrogenated 5αCS; magenta arrow, epimerized 5αCS; purple arrow, CA. The height of each peak is shown as the relative percentage that was normalized to the highest peak of the metabolites detected. Representative chromatographs of zebrafish microbiota from four independent biological replicate cultures are shown. |