
FIGURE
Fig. 2
- ID
- ZDB-FIG-220409-2
- Publication
- Monroe et al., 2022 - Identification of novel lipid biomarkers in xmrk- and Myc-induced models of hepatocellular carcinoma in zebrafish
- Other Figures
- All Figure Page
- Back to All Figure Page
Fig. 2
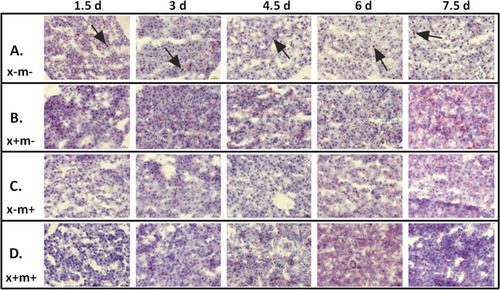
Lipid levels increase in zebrafish liver HCC tissue. Representative images of Oil-Red-O stained zebrafish tissue taken from three mpf DOX-treated zebrafish (1.5 to 7.5 dpt). Lipid droplets are stained in red and nuclei are counterstained in blue. |
Expression Data
Expression Detail
Antibody Labeling
Phenotype Data
| Fish: | |
|---|---|
| Condition: | |
| Observed In: | |
| Stage: | Adult |
Phenotype Detail
Acknowledgments
This image is the copyrighted work of the attributed author or publisher, and
ZFIN has permission only to display this image to its users.
Additional permissions should be obtained from the applicable author or publisher of the image.
Full text @ Cancer Metab