|
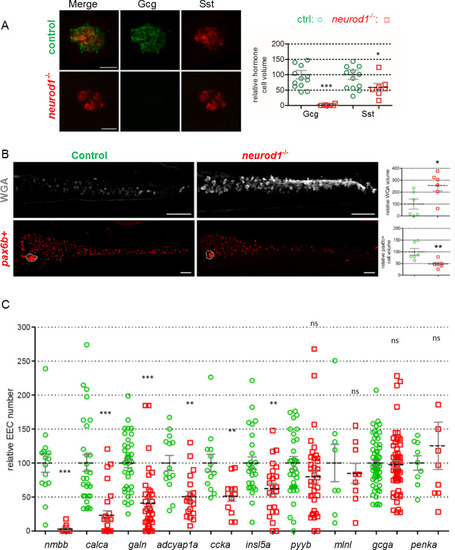
<italic toggle='yes'>neurod1</italic><sup>-/-</sup> displays an increase of goblet cells concomitant with a reduction of EECs.A: Immunodetection at 96hpf of Gcg and Sst cells of neurod1-/- homozygous mutant compared to control sibling embryos. Quantification was performed by quantifying the volume occupied by the cells using the Imaris software. Views represent confocal projection images. Scale bars: 20 μm. B: Immunodetection at 96hpf of goblet cells (WGA) or pax6b+ cells of neurod1ΔUCE homozygous mutant compared to control sibling embryos. Quantification was performed by quantifying the volume occupied by the cells using the Imaris software. Views represent confocal projection images with the anterior part to the left. The pancreas are encircled with dotted lines. Scale bars: 50 μm. C: Quantification of the relative number of EECs detected by FISH performed at 96hpf on neurod1ΔUCE homozygous mutant compared to control sibling embryos. Quantification was done by counting the cells under a fluorescent stereomicroscope. The mean is indicated by a dashed line and the S.E by solid lines. Asterisks indicate that the differences between controls and neurod1-/- mutants are statistically significant using the Mann-Whitney U-test (***: P <0.001; **: P <0.01; *: P <0.05, ns: P >0.05).
|