|
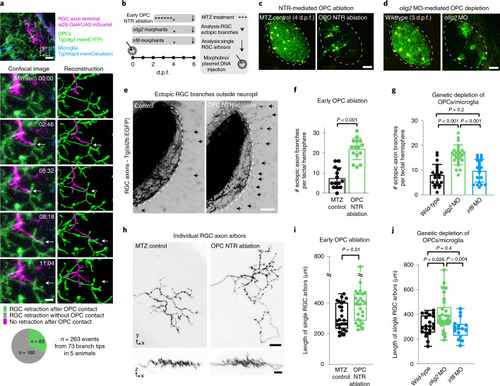
Early OPC depletion causes formation of aberrant RGC arborizations.a, Time lapse showing dynamic interactions between RGC axon arbors and OPC processes. Dashed box indicates the position of time lapse shown. Arrows indicate when extending RGC process interdigitates with OPC process and subsequently retracts (see Supplementary Video 6 for 3D rotation to demonstrate contact). Pie chart shows frequency of RGC retractions with and without prior OPC contact. Scale bars, 10 µm (top) and 2 µm (bottom). b, Timelines of manipulations in this figure. c, d, Example images of NTR-mediated OPC ablation (c) and olig2 morpholino-mediated OPC depletion. Dashed lines indicate neuropil. Scale bars, 25 µm. e, f, Increased formation of ectopic RGC axon branches extending outside tectal neuropil (arrows) upon early ablation of OPCs (mean 7.5 ± 5.1 s.d. in control versus 22.0 ± 5.3 in OPC NTR ablation, n = 14/15 animals from four experiments, unpaired two-tailed t-test, t = 7.466, d.f. = 27). Dashed lines indicate the border between NP and PVN. Scale bar, 20 µm. g, Increased formation of ectopic RGC axon branches upon genetic OPC reduction (olig2 morphants) but not upon microglial depletion (irf8 morphants) (mean 7.9 ± 4.3 s.d. in control versus 16.2 ± 3.9 in olig2 MO versus 9.7 ± 4.6 in irf8 MO, n = 21/25/20 animals from three experiments, one-way ANOVA, F2,63 = 23.69). h, i, Increased size of single RGC arbors upon early OPC ablation (top) while maintaining single lamina layering (bottom) (median 287 ± 403/235 IQR in control versus 393 ± 461/286 in OPC NTR ablation, n = 26/27 axons in 24/23 animals from three experiments, two-tailed Mann–Whitney U-test, U = 210). Scale bars, 10 µm. j, Increased size of single RGC arbors upon genetic OPC depletion (olig2 morphants) but not upon microglial depletion (irf8 morphants) (median 304 ± 391/255 IQR in control versus 355 ± 458/326 in olig2 MO versus 285 ± 323/229 in irf8 MO, n = 21/30/16 axons in 11/14/12 animals from five experiments, Kruskal–Wallis test, test statistic = 9.9). MO, morphant.
|