|
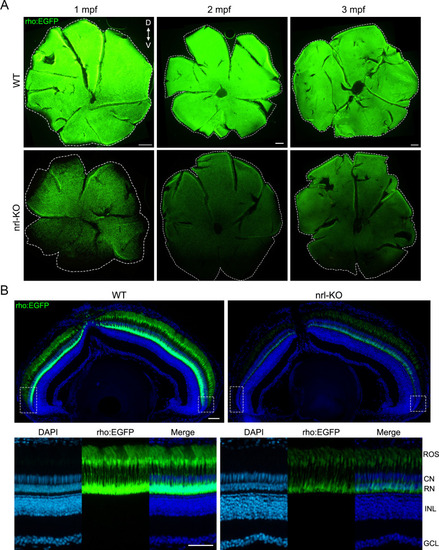
Distribution of the rods and expression of the rod opsin in the WT and <italic toggle='yes'>nrl</italic>-KO retinas from 1 mpf to 3 mpf.(A) The Tg(rho:EGFP) transgenic line was used to label rods with EGFP. Representative images of flattened whole-mount retinas from WT and nrl-KO zebrafish at 1 mpf, 2 mpf, and 3 mpf are shown. The dashed lines indicate the edges of the retinas. Scale bars: 200 μm. (B) EGFP-labeled rods were observed on the retinal sections from WT and nrl-KO Tg(rho:EGFP) transgenic zebrafish at 1 mpf. The overall views are shown in the upper panel. The regions nearby the ciliary marginal zone (labeled with boxes) showed no or little fluorescence signal of rods. Enlarged images of the dorsal retinal regions are shown in the lower panel. ROS, rod outer segment; CN, cone nuclear layer; RN, rod nuclear layer; INL, inner nuclear layer; GCL: ganglion cell layer. Scale bars: 50 μm.
|