
Fig. 8
- ID
- ZDB-FIG-220310-13
- Publication
- Del Vecchio et al., 2021 - Leptin receptor-deficient (knockout) zebrafish: effects on nutrient acquisition
- Other Figures
- All Figure Page
- Back to All Figure Page
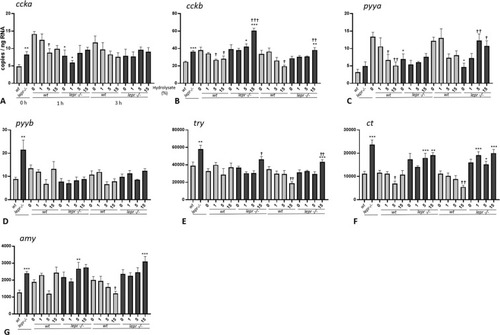
(A-G). Effect of lactalbumin hydrolysate administration on digestion and absorption related genes in larval trunk (8 dpf). Values are mean ± SE (n = 8). Differences in tube-feeding test with respect to the values on the 0% hydrolysate group (indicated by †) within each zebrafish line (lepr−/−or wt) were assessed by one-way ANOVA. Differences between the lines at each sampling time (indicated by *) were assessed by two-way ANOVA. Two-way ANOVA shows no significant effect of concentration [F (3, 48) = 1.085; p > 0.05] but significant effect of genotype [F (1, 48) = 12.07; p < 0.01] at 1 h and no significant effects of concentration [F (3, 48) = 0.3605; p > 0.05] and genotype [F (1, 48) = 0.5396; p > 0.05] at 3 h for ccka; significant effects of concentration [F (3, 53) = 3.643; p < 0.05] and genotype [F (1, 53) = 35.53; p < 0.0001] at 1 h and no significant effects of concentration [F (3, 54) = 1.226; p > 0.05] and genotype [F (1, 54) = 2.163; p > 0.05] at 3 h for cckb; significant effects of concentration [F (3, 55) = 3.122; p < 0.05] and genotype [F (1, 55) = 5.575; p < 0.05] at 1 h and no significant effects of concentration [F (3, 56) = 0.4206; p > 0.05] and genotype [F (1, 56) = 1.593; p > 0.05] at 3 for pyya; no significant effect of concentration [F (3, 56) = 1.655; p > 0.05] but a significant effect of genotype [F (1, 56) = 8.044; p < 0.01] at 1 h and significant effect of concentration [F (3, 54) = 4.045; p < 0.05] but not of genotype [F (1, 54) = 2.308; p > 0.05] at 3 h for pyyb; significant effect of concentration [F (3, 55) = 3.464; p < 0.05] but not of genotype [F (1, 55) = 0.2529; p > 0.05] at 1 h and no significant effect of concentration [F (3, 56) = 0.6295; p > 0.05] but significant effect of genotype [F (1, 56) = 9.654; p < 0.01] at 3 h for try; no significant effect of concentration [F (3, 55) = 1.443; p > 0.05] but significant effect of genotype [F (1, 55) = 43.10; p < 0.0001] at 1 h and no significant effect of concentration [F (3, 56) = 1.362; p > 0.05] but significant effect of genotype [F (1, 56) = 78.56; p < 0.0001] at 3 h for ct; significant effects of concentration [F (3, 55) = 4.853; p < 0.05] and genotype [F (1, 55) = 6.070; p < 0.05] at 1 h and no significant effect of concentration [F (3, 56) = 0.1714; p > 0.05], but significant effect of genotype [F (1, 56) = 23.34; p < 0.0001] at 3 h for amy. A Dunnett’s multiple comparison test for one-way ANOVA and a post-hoc Turkey’s multiple comparison were used to assess for specific pairwise differences (*, † = p < 0.05; **, †† = p < 0.01 and ***, ††† = p < 0.001). |