
Fig. 6
- ID
- ZDB-FIG-220310-11
- Publication
- Del Vecchio et al., 2021 - Leptin receptor-deficient (knockout) zebrafish: effects on nutrient acquisition
- Other Figures
- All Figure Page
- Back to All Figure Page
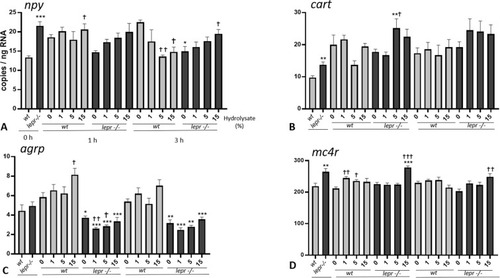
(A-D). Effect of lactalbumin hydrolysate administration on appetite related genes in larval head (8 dpf). Values are mean ± SE (n = 8). Differences in tube-feeding test with respect to the values on the 0% hydrolysate group (indicated by †) within each zebrafish line (lepr−/−or wt) were assessed by one-way ANOVA. Differences between the lines at each sampling time (indicated by *) were assessed by two-way ANOVA. Two-way ANOVA shows no significant effects of concentration [F (3, 55) = 2.311; p > 0.05] and genotype [F (1, 55) = 2.956; p > 0.05] at 1 h and no significant effects of concentration [F (3, 55) = 1.466; p > 0.05] and genotype [F (1, 55) = 0.004; p > 0.05] at 3 h for npy; no significant effects of concentration [F (3, 56) = 0.4654; p > 0.05] and genotype [F (1, 56) = 1.874; p > 0.05] at 1 h and no significant effect of concentration [F (3, 56) = 0.6222; p > 0.05] but significant effect of genotype [F (1, 56) = 6.588; p < 0.05] at 3 h for cart; significant effects of concentration [F (3, 56) = 3.010; p < 0.05] and genotype [F (1, 56) = 118.6; p < 0.0001] at 1 h and significant effects of concentration [F (3, 56) = 3.735; p < 0.05] and genotype [F (1, 56) = 100.4; p < 0.0001] at 3 h for agrp; significant effect of concentration [F (3, 56) = 14.43; p < 0.0001] but no significant effect of genotype [F (1, 56) = 2.571; p > 0.05] at 1 h and no significant effects of concentration [F (3, 56) = 1.912; p > 0.05] and genotype [F (1, 56) = 0.6626; p > 0.05] at 3 h for mc4r. A Dunnett’s multiple comparison test for one-way ANOVA and a post-hoc Turkey’s multiple comparison were used to assess for specific pairwise differences (*, † = p < 0.05; **, †† = p < 0.01 and ***, ††† = p < 0.001). |