
Figure 5
- ID
- ZDB-FIG-220302-203
- Publication
- Confino et al., 2022 - A Zebrafish Model for a Rare Genetic Disease Reveals a Conserved Role for FBXL3 in the Circadian Clock System
- Other Figures
- All Figure Page
- Back to All Figure Page
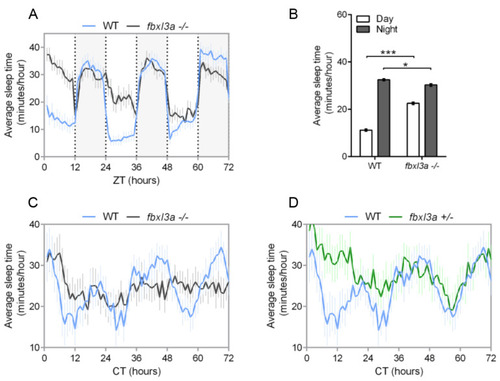
FBXL3a deficiency affects sleep–wake cycles in zebrafish larvae. Sleep analysis of 6–8 dpf fbxl3a−/−, fbxl3a+/− and WT sibling larvae under various lighting conditions. (A) Rhythms of sleep under LD are impaired in fbxl3a−/− larvae. The average sleep time under LD (minutes/hour) is plotted on the y-axis and ZT (hours) is plotted on the x-axis. Error bars represent ± SE (n = 24). White and grey-shaded areas indicate light and dark, respectively. (B) The average sleep time (±SE, n = 24) for total daytime and total nighttime for each genotype under LD conditions. Significant differences in day/night sleep time alterations were found between fbxl3a−/− larvae and their WT siblings (*** p < 0.001 and * p < 0.05 for day and night, respectively, repeated-measures ANOVA). (C) Circadian rhythms of sleep under DimDim, after entrainment by 3 LD and 2 LDim cycles, are impaired in fbxl3a−/− larvae (n = 18) compared to WT siblings (n = 12). The average sleep time (minutes/hour) under DimDim is plotted on the y-axis and CT (hours) is plotted on the x-axis. Error bars indicate ± SE. (D) Circadian rhythms of sleep under DimDim are impaired in fbxl3a+/− larvae (n = 18) compared to WT siblings (n = 12), the WT trace is the same as in C. Sleep measurement was conducted after entrainment by 3 LD and 2 LDim cycles. The average sleep time (minutes/hour) under DimDim is plotted on the y-axis and CT (hours) is plotted on the x-axis. Error bars represent ± SE. |
| Fish: | |
|---|---|
| Conditions: | |
| Observed In: | |
| Stage: | Days 7-13 |