
FIGURE
Figure 2
- ID
- ZDB-FIG-220302-200
- Publication
- Confino et al., 2022 - A Zebrafish Model for a Rare Genetic Disease Reveals a Conserved Role for FBXL3 in the Circadian Clock System
- Other Figures
- All Figure Page
- Back to All Figure Page
Figure 2
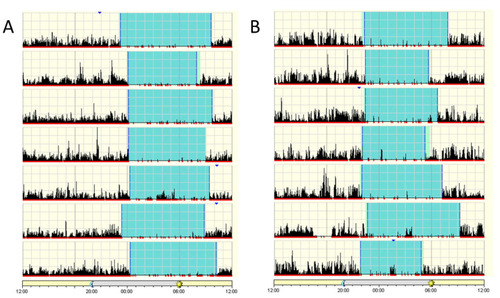
Patient actigraphs. Each horizontal segment in the actigraph represents a 24 h period from noon to noon the next day. The black lines indicate physical activity, with height of the lines corresponding to the occurrence and degree of physical activity. Periods of rest are highlighted in light green and sleep in cyan. (A) Patient IV-5, 10-year-old male. (B) Patient IV-3, 18-year-old female. Actigraphs show a regular sleep pattern with a set sleep time and mostly minor variations in wake-up time. |
Expression Data
Expression Detail
Antibody Labeling
Phenotype Data
Phenotype Detail
Acknowledgments
This image is the copyrighted work of the attributed author or publisher, and
ZFIN has permission only to display this image to its users.
Additional permissions should be obtained from the applicable author or publisher of the image.
Full text @ Int. J. Mol. Sci.