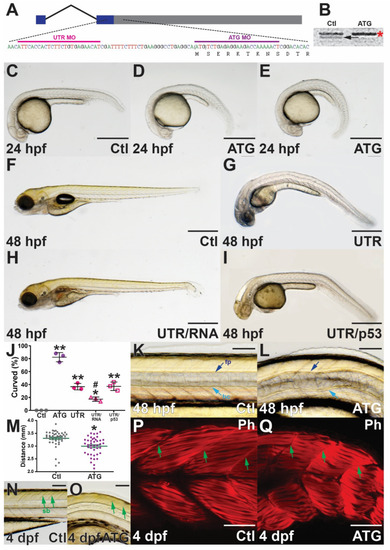
Phenotypic consequences of socs4a knockdown. Schematic of socs4a mRNA schematic showing exons boxed and joined by a thin line, with non-coding sequence in blue and coding in grey. Sequences targeted by ATG MO (purple) and UTR MO (pink) are indicated (A). Confirmation of ATG MO efficacy by in vitro transcription and translation of socs4a in the presence of control (Ctl) or ATG MO with the arrow indicating the position of the Socs4a protein at ~44 kDa and the asterisk a non-specific protein (B). Analysis of embryos injected with Ctl (C,F,K,N,P), ATG (D,E,L,O,Q) or UTR (G) MO, or combined UTR MO with MO-resistant socs4a mRNA (UTR/RNA, (H)) or with p53 MO (UTR/p53, (I)) by either light microscopy (C–I,K,L,N,O) or fluorescence microscopy of phalloidin (Ph) staining of muscle fibers (P,Q). All embryos are positioned with their anterior to the left and images are lateral view. Scale bars = 0.5 mm (C–I) or 0.1 mm (K,L,N,Q). The ventral curl phenotype in Ctl, ATG, UTR, UTR/RNA and UTR/p53 MO was quantified, and shown as mean ± SEM, with statistical significance versus Ctl (p < 0.05: *; p < 0.01: **) or UTR (p < 0.05: #) shown (J). Embryo length (anterior–posterior) at 4 dpf is provided for individual embryos, with mean ± SEM and statistical significance versus Ctl indicated (p < 0.05: *) (M). Abbreviations: fp, floor plate; hc, hypochord; sb, somite boundary.
|
