
Figure 5
- ID
- ZDB-FIG-220203-53
- Publication
- Zhu et al., 2021 - Nucleolar GTPase Bms1 displaces Ttf1 from RFB-sites to balance progression of rDNA transcription and replication
- Other Figures
- All Figure Page
- Back to All Figure Page
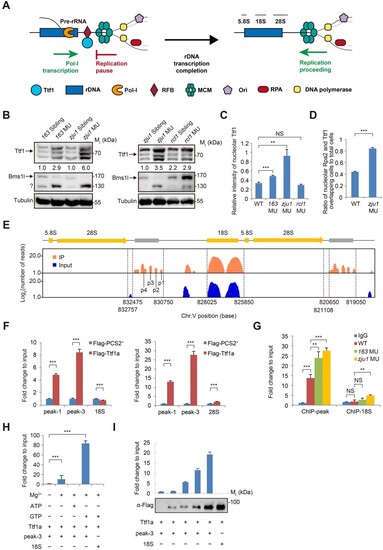
Ttf1 is accumulated on its binding sites in bms1l mutants. (A) A drawing to illustrate the head-on conflict between rDNA transcription and replication during the S-phase in higher eukaryotes. Binding of Ttf1 to the RFB-site prevents the conflict. Once the transcription is completed, Ttf1 is proposed to leave the RFB-site to allow progression of the replication fork; however, how Ttf1 is dissociated from the RFB-site remains unknown. (B) Western blotting showing an increase of Ttf1 protein level in bms1lsq163/sq163 and bms1lzju1/zju1 but not in rcl1−/− compared with their corresponding siblings at 5dpf. Tubulin: loading control. ?: unknown protein. (C) Signal intensity of nucleolar Ttf1 in the gut epithelia was significantly higher in bms1lsq163/sq163 and bms1lzju1/zju1 than in WT and rcl1−/−. Samples: three WT embryos, 364 cells counted; three bms1lsq163/sq163 embryos, 183 cells counted; three bms1lzju1/zju1 embryos, 98 cells counted; three rcl1−/− embryos, 176 cells counted. (D) Ratio of the nucleoli displaying intervening signals of Ttf1 and Rpa2 in the gut epithelia was significantly higher in bms1lzju1/zju1 than in WT. Samples: three WT embryos, 264 cells examined; three bms1lzju1/zju1 embryos, 140 cells examined. (E) ChIP‒seq identification of Ttf1-binding sites (peak-1 to peak-4) downstream of the 3ʹ-end of rDNA gene on chromosome 5 (Chr.V). (F) ChIP‒qPCR analysis showing the strong binding of Flag-tagged Ttf1a to peak-1 and peak-3 but not to the 18S (left panel) or 28S (right panel) rDNA. (G) Endogenous Ttf1 showed significant enrichment on its binding sites (ChIP-peak: peak-1 to peak-4) in bms1lsq163/sq163 (163 MU) and bms1lzju1/zju1 (zju1 MU) than in WT at 3dpf. IgG and ChIP-18S: negative controls. (H and I) ChIP‒qPCR analysis showing that, in the presence of Mg2+, the binding of purified Ttf1a to peak-3 depends on GTP but not ATP (H) and is correlated to the dosage of purified Ttf1a (I). Lower panel in I: Ttf1a was examined by western blotting. In C, D, and F‒H, **P < 0.01, ***P < 0.001; NS, no significance. |