
Figure 3
- ID
- ZDB-FIG-220203-50
- Publication
- Zhu et al., 2021 - Nucleolar GTPase Bms1 displaces Ttf1 from RFB-sites to balance progression of rDNA transcription and replication
- Other Figures
- All Figure Page
- Back to All Figure Page
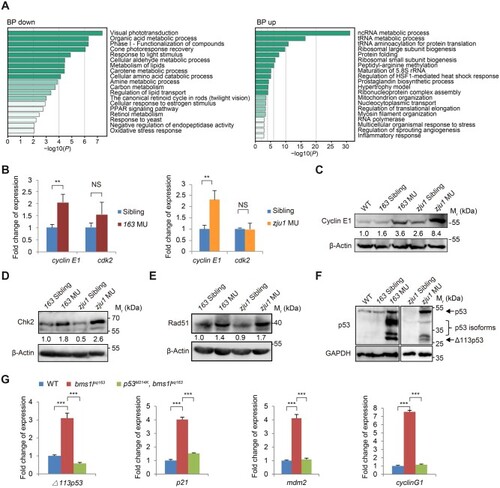
Bms1l mutations activate DNA-damage response. (A) GO enrichment analysis of the biological process (BP) category of RNA-seq data from WT and bms1lzju1/zju1 mutant embryos at 3dpf. BP up, enrichment of upregulated genes; BP down, enrichment of downregulated genes. (B) qPCR analysis showing the elevated expression of cyclin E1 but not cdk2 in both bms1lsq163/sq163 and bms1lzju1/zju1 mutants at 5dpf. (C–F) Western blotting showing that the protein levels of Cyclin E1 (C) and DNA-damage response markers Chk2 (D), Rad51 (E), p53 and p53 isoforms (F) were obviously increased in both bms1lsq163/sq163 and bms1lzju1/zju1 compared with their siblings or WT at 5dpf. β-Actin and GAPDH: loading control. (G) qPCR analysis of the expression of △113p53, p21, mdm2, and cyclinG1 in 5dpf-old bms1lsq163/sq163 mutant, bms1lsq163/sq163p53M214K/M214K double-mutant and WT. The upregulated expression of these four genes in the bms1lsq163/sq163 mutant was restored to the WT level in bms1lsq163/sq163p53M214K/M214K double-mutant. 163 MU, bms1lsq163/sq163; zju1 MU, bms1lzju1/zju1. In B and G, **P < 0.01, ***P < 0.001; NS, no significance. |