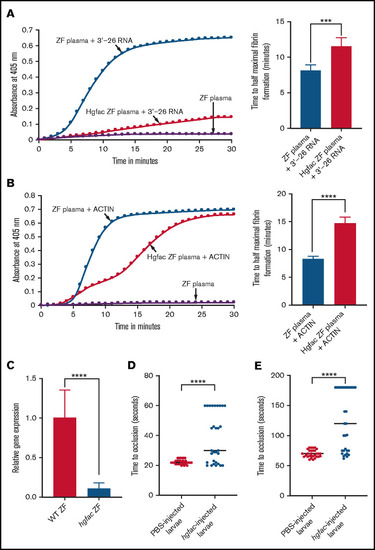
hgfac knockdown in zebrafish plasma exhibits a reduction in coagulation activation by 3'-26 RNA and Dade Actin. (A-B) Left graphs show the increasing fibrin formation with increasing time in the kinetic coagulation assay. (A) Left graph: curves were obtained from zebrafish plasma in the presence of 3'-26 RNA or zebrafish plasma with hgfac knockdown, and zebrafish plasma in the absence of RNA. Bar graph shows a significant shortening of the time to half-maximal fibrin formation (using data obtained from the left graph) with zebrafish plasma in the presence of 3'-26 RNA compared with that in hgfac knockdown plasma (n = 6). (B) Left graph: curves were obtained from zebrafish plasma with Dade Actin or with hgfac knockdown and in the absence of Dade Actin. Bar graph shows a significant shortening of the time to half-maximal fibrin formation (using data obtained from the left graph) in zebrafish plasma with Dade Actin compared with hgfac knockdown plasma (n = 4). For curves in panels A and B, the time in minutes was plotted against the absorbance at 405 nm at 25°C. The data for time to half-maximal fibrin formation (in minutes) were analyzed using Student t test and are shown as mean ± SEM. (C) qRT-PCR showing the reduction of hgfac mRNA levels after hgfac knockdown. The relative fold change in gene expression of hgfac is shown . Wild-type (WT) zebrafish are the PBS-injected control, and hgfac indicates the antisense piggyback hybrid primer-injected zebrafish (n = 6). The data for relative fold change in gene expression were analyzed using Student t test and are shown as mean ± SEM. (D-E) Inhibition of venous thrombosis (D) and arterial thrombosis (E) by hgfac knockdown in zebrafish larvae. Prolongation of the TTO in the caudal vein (D) and caudal artery (E) of larvae injected with hgfac piggyback hybrid primer is significant compared with that in the larvae injected with PBS (n = 30). The data were analyzed using Student t test and are shown as mean ± SEM . ***P < .001; ****P < .0001.
|
