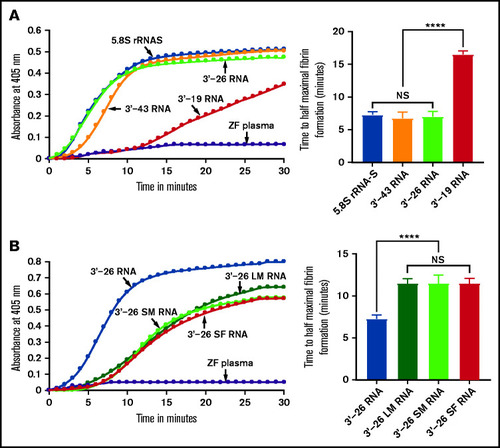
Activation of zebrafish plasma by 3'-26 RNA. (A-B) Left graphs show the increasing fibrin formation with increasing time in the kinetic coagulation assay. (A) Left graph: curves were obtained from zebrafish plasma in the presence of 5.8S rRNA-S, 3'-43 RNA, 3'-26 RNA, and 3'-19 RNA and in the absence of RNA. Bar graph shows a significant shortening of the time to half-maximal fibrin formation (using data obtained from the left graph) of zebrafish plasma with 5.8S rRNA-S, 3'-43 RNA, and 3'-26 RNA compared with 3'-19 RNA. (B) Left graph: curves were obtained from zebrafish plasma in the presence of 3'-26 RNA, 3'-26 LM RNA, 3'-26 SM RNA, and 3'-26 SF RNA and in the absence of RNA. Bar graph shows a significant shortening of the time to half-maximal fibrin formation (using data obtained from the left graph) of zebrafish plasma with 3'-26 RNA compared with 3'-26 LM RNA, 3'-26 SM RNA, and 3'-26 SF RNA (n = 4). For panel A and B curves, the time (in minutes) was plotted against absorbance at 405 nm at 25°C. The data for time to half-maximal fibrin formation (in minutes) were analyzed using one-way ANOVA and are shown as mean ± SEM. ****P < .0001. LM, loop mutation; SF, stem flipping; SM, stem mutation.
|
