FIGURE SUMMARY
Title

Role of Ribosomal RNA Released from Red Cells in Blood Coagulation in Zebrafish and Humans

Authors
Alharbi, A., Iyer, N., AlQaryoute, A., Raman, R., Burks, D., Azad, R., Jagadeeswaran, P.
Source
Full text @ Blood Adv

Analysis of the RBC lysates. Zebrafish (ZF) (A) and human (H) (B) RBC lysates were run on 5% native polyacrylamide gel and stained with EtBr. Arrows show a single band of nucleic acid. Double-stranded DNA size markers are indicated by “Marker.” (C) NaOH treatment of the gel-purified nucleic acid (indicated by arrow) from the zebrafish RBC lysates shows disappearance of the nucleic acid. (D) Quality of the purified RNA from zebrafish RBC lysates was checked by Omega Bioservices using a denaturing gel. Arrows indicate the purified RNA (150 nucleotides long) and the internal marker (25 nucleotides long). The standard RNA size markers are shown on the left.

Activation of zebrafish and human plasmas by gel-purified RNA from RBC lysates. (A-B) Left graphs show increasing fibrin formation with increasing time in the kinetic coagulation assay. The curves were obtained from (A) zebrafish plasma with RNA (A) and human plasma with RNA or FXII-deficient (FXII) (B) human plasma with RNA; both panels show plasma with Dade Actin and in the absence of RNA or Dade Actin (control). The bar graphs on the right show a significant shortening of the time to half-maximal fibrin formation (using data from the left graphs) (A) for zebrafish plasma with RNA and without RNA (control) and (B) for normal human plasma with RNA and FXII human plasma with RNA (n = 4). The time (in minutes) was plotted against the absorbance at 405 nm at 25°C. The data were analyzed using Student t test and are shown as mean ± standard error of the mean (SEM). ****P < .0001.

Comparison of activation of coagulation by 5.8S rRNA, 5'-119 SmaI RNA, 5.8S rRNA-S, 3'-35 RNA, and 5'-119 RNA. (A) Left: zebrafish gel-purified 5.8S rRNA was used as a template to generate 5.8S DNA by using RT-PCR. The bands corresponding to 5.8S RNA and 5.8S DNA are shown on 5% polyacrylamide gel. Middle: SmaI digestion of 5.8S DNA to generate 5'-119 SmaI RNA. Right: 5.8S DNA sequence containing 2 SmaI restriction sites (indicated by arrows). (B-C) Left graphs show increasing fibrin formation with increasing time in the kinetic coagulation assay. (B) Left graph: curves were obtained from zebrafish plasma that contained 5.8S rRNA or 5'-119 SmaI RNA or had no RNA. Bar graph shows a significant shortening of time to half-maximal fibrin formation (using data obtained from the left graph) of the zebrafish plasma with 5.8S rRNA compared with zebrafish plasma with 5'-119 SmaI RNA (n = 4). The data for time to half-maximal fibrin formation (in minutes) were analyzed using Student t test and are shown as mean ± SEM. (C) Left graph: curves were obtained from zebrafish plasma that contained 5.8S rRNA-S, 3'-35 RNA, or 5'-119 RNA, or with no RNA. Bar graph shows a significant shortening of the time to half-maximal fibrin formation (obtained from the left graph) of zebrafish plasma with 5.8S rRNA-S or 3'-35 RNA compared with 5'-119 RNA (n = 4). The data for time to half-maximal fibrin formation (in minutes) were analyzed using one-way analysis of variance (ANOVA) and are show as mean ± SEM. For panel B and C curves, the time (in minutes) was plotted against the absorbance at 405 nm at 25°C. For more detail, see supplemental Table 2. ****P < .0001. NS, not significant.

Activation of zebrafish plasma by 3'-26 RNA. (A-B) Left graphs show the increasing fibrin formation with increasing time in the kinetic coagulation assay. (A) Left graph: curves were obtained from zebrafish plasma in the presence of 5.8S rRNA-S, 3'-43 RNA, 3'-26 RNA, and 3'-19 RNA and in the absence of RNA. Bar graph shows a significant shortening of the time to half-maximal fibrin formation (using data obtained from the left graph) of zebrafish plasma with 5.8S rRNA-S, 3'-43 RNA, and 3'-26 RNA compared with 3'-19 RNA. (B) Left graph: curves were obtained from zebrafish plasma in the presence of 3'-26 RNA, 3'-26 LM RNA, 3'-26 SM RNA, and 3'-26 SF RNA and in the absence of RNA. Bar graph shows a significant shortening of the time to half-maximal fibrin formation (using data obtained from the left graph) of zebrafish plasma with 3'-26 RNA compared with 3'-26 LM RNA, 3'-26 SM RNA, and 3'-26 SF RNA (n = 4). For panel A and B curves, the time (in minutes) was plotted against absorbance at 405 nm at 25°C. The data for time to half-maximal fibrin formation (in minutes) were analyzed using one-way ANOVA and are shown as mean ± SEM. ****P < .0001. LM, loop mutation; SF, stem flipping; SM, stem mutation.

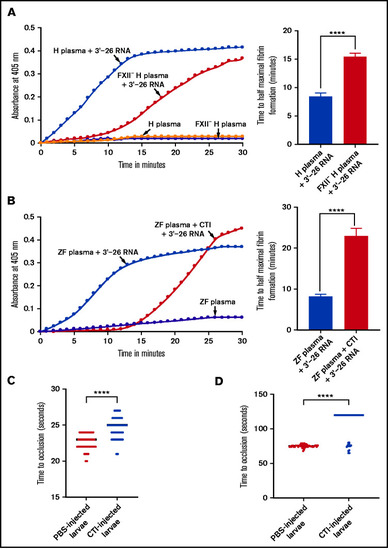
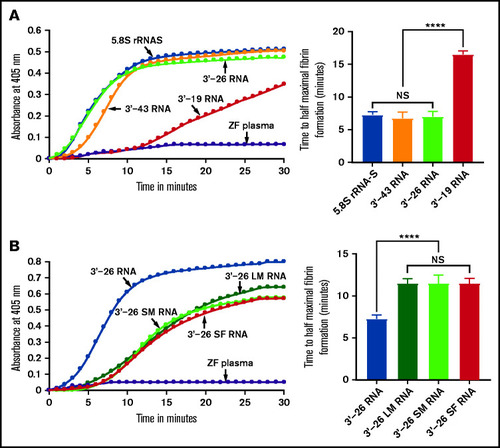
Lack of activation of FXII-deficient human plasma or zebrafish plasma in the presence of CTI by 3'-26 RNA. (A-B) Left graphs show the increasing fibrin formation with increasing time in the kinetic coagulation assay. (A) Left graph: curves were obtained from normal and FXII-deficient human plasma in the presence of 3'-26 RNA and in the absence of RNA. Bar graph shows a significant shortening of the time to half-maximal fibrin formation (using data obtained from the left graph); normal human plasma is compared with FXII-deficient human plasma in the presence of 3'-26 RNA. (B) Left graph: curves were obtained from zebrafish plasma activated by 3'-26 RNA in the absence or presence of CTI and in the absence of both RNA and CTI. Bar graph shows a significant shortening of the time to half-maximal fibrin formation (using data obtained from the left graph) for zebrafish plasma activated by 3'-26 RNA in the absence or presence of CTI (n = 4). For curves in panels A and B, the time in minutes was plotted against the absorbance at 405 nm at 25°C. The data for time to half-maximal fibrin formation (in minutes) were analyzed using Student t test and are shown as mean ± SEM. (C-D) Inhibition of venous thrombosis (C) and arterial thrombosis (D) by CTI in zebrafish larvae. Prolongation of the TTO in the caudal vein (C) and the caudal artery (D) of CTI-injected larvae was significant compared with that for the PBS-injected larvae (n = 48). The data were analyzed using Student t test and are shown as mean ± SEM. ****P < .0001.

hgfac knockdown in zebrafish plasma exhibits a reduction in coagulation activation by 3'-26 RNA and Dade Actin. (A-B) Left graphs show the increasing fibrin formation with increasing time in the kinetic coagulation assay. (A) Left graph: curves were obtained from zebrafish plasma in the presence of 3'-26 RNA or zebrafish plasma with hgfac knockdown, and zebrafish plasma in the absence of RNA. Bar graph shows a significant shortening of the time to half-maximal fibrin formation (using data obtained from the left graph) with zebrafish plasma in the presence of 3'-26 RNA compared with that in hgfac knockdown plasma (n = 6). (B) Left graph: curves were obtained from zebrafish plasma with Dade Actin or with hgfac knockdown and in the absence of Dade Actin. Bar graph shows a significant shortening of the time to half-maximal fibrin formation (using data obtained from the left graph) in zebrafish plasma with Dade Actin compared with hgfac knockdown plasma (n = 4). For curves in panels A and B, the time in minutes was plotted against the absorbance at 405 nm at 25°C. The data for time to half-maximal fibrin formation (in minutes) were analyzed using Student t test and are shown as mean ± SEM. (C) qRT-PCR showing the reduction of hgfac mRNA levels after hgfac knockdown. The relative fold change in gene expression of hgfac is shown . Wild-type (WT) zebrafish are the PBS-injected control, and hgfac indicates the antisense piggyback hybrid primer-injected zebrafish (n = 6). The data for relative fold change in gene expression were analyzed using Student t test and are shown as mean ± SEM. (D-E) Inhibition of venous thrombosis (D) and arterial thrombosis (E) by hgfac knockdown in zebrafish larvae. Prolongation of the TTO in the caudal vein (D) and caudal artery (E) of larvae injected with hgfac piggyback hybrid primer is significant compared with that in the larvae injected with PBS (n = 30). The data were analyzed using Student t test and are shown as mean ± SEM . ***P < .001; ****P < .0001.

Inhibition of 5.8S rRNA– and 3'-26 RNA–mediated activation of zebrafish plasma in the presence of 5.8S RmAb. (A-B) Left graphs show the increasing fibrin formation with increasing time in the kinetic coagulation assay. (A) Left graph: curves were obtained from zebrafish plasma that contained 5.8S rRNA plus IgG or 5.8S rRNA plus 5.8S RmAb, and in the absence of RNA and antibody. Bar graph shows a significant shortening of the time to half-maximal fibrin formation (using data obtained from the left graph) in zebrafish plasma containing 5.8S rRNA plus IgG compared with zebrafish plasma containing 5.8S rRNA plus 5.8S RmAb (n = 4). The data for time to half-maximal fibrin formation (in minutes) were analyzed using Student t test and are shown as mean ± SEM . ****P < .0001. (B) Left graph: curves were obtained from zebrafish plasma that contained 3'-26 RNA plus IgG or 3'-26 RNA plus 5.8S RmAb, and without RNA, IgG, and antibody. Bar graph shows a significant shortening of the time to half-maximal fibrin formation (using data obtained from the left graph) in zebrafish plasma that contained 3'-26 RNA plus IgG compared with zebrafish plasma that contained 3'-26 RNA plus 5.8S RmAb (n = 4). The data for time to half-maximal fibrin formation (in minutes) were analyzed using Student t test and are shown as mean ± SEM. *** P < .001. For curves in panels A and B, the time (in minutes) was plotted against the absorbance at 405 nm at 25°C. (C) Left: adult zebrafish were IV injected with either IgG or 5.8S RmAb and were subjected to the caudal vessel bleeding assay. Bar graph shows increased total red pixel intensities in zebrafish injected with IgG compared with zebrafish injected with 5.8S RmAb (n = 6). The total red pixel intensity data were analyzed using Student t test and are shown as mean ± SEM. ***P < .001. (D-E) Inhibition of venous thrombosis (D) and arterial thrombosis (E) by 5.8S RmAb in zebrafish larvae. Graphs show a significant prolongation of the TTO (in seconds) in the caudal vein (D) or caudal artery (E) of larvae injected with 5.8S RmAb compared with larvae injected with IgG (n = 48). (D-E) The data were analyzed using Student t test and are shown as mean ± SEM. ****P < .0001.

Acknowledgments
This image is the copyrighted work of the attributed author or publisher, and ZFIN has permission only to display this image to its users. Additional permissions should be obtained from the applicable author or publisher of the image. Full text @ Blood Adv