
Fig. 4
- ID
- ZDB-FIG-220131-78
- Publication
- Kozol et al., 2021 - Restoring Shank3 in the rostral brainstem of shank3ab-/- zebrafish autism models rescues sensory deficits
- Other Figures
- All Figure Page
- Back to All Figure Page
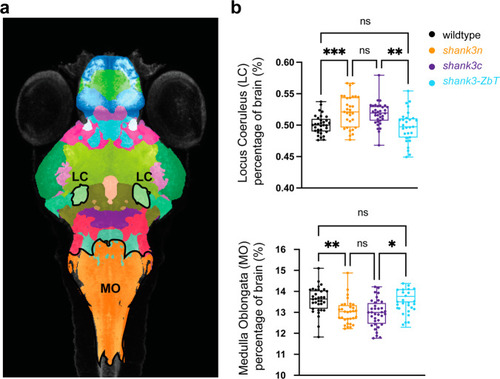
a z-stack image from CobraZ reference and 26 segment atlas. Regions outlined in black denote the locus coeruleus (LC) and medulla oblongata (MO). Scale bar = 100 µm. b Box plots comparing relative volume of LC and MO brain segments in wild-type, shank3abΔn and shank3abΔc mutants, and shank3ab mutants with wild-type transplanted brain stems (shank3abΔZb-T). Exact sample sizes of biologically independent samples for each condition and genotype (n = lights-on/lights-off); wild-type (n = 16/19), shank3abΔN (n = 19/21) and shank3abΔC (n = 16/15). Boxes denote the median, 1st and 3rd quartile, while whiskers represent the minimum and maximum values. Brain segment sizes were analyzed using a non-parametric Kruskal–Wallis one-way ANOVA and followed by a Dunn’s corrected multiple values comparison. P-value asterisks represent; p < 0.05 - *, p < 0.01 - **, p < 0.001 - ***, p < 0.0001-****. Source data for plots are provided in Supplementary Data 2. |