
Fig. 3
- ID
- ZDB-FIG-220131-71
- Publication
- Kozol et al., 2021 - Restoring Shank3 in the rostral brainstem of shank3ab-/- zebrafish autism models rescues sensory deficits
- Other Figures
- All Figure Page
- Back to All Figure Page
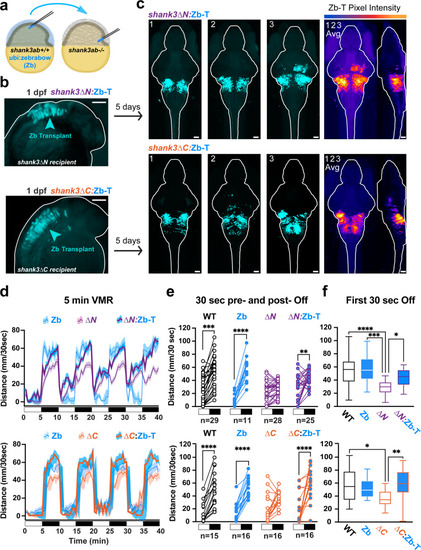
a A cartoon shows how cells from wild type donor embryos marked by a ubiquitously expressed dTomato fluorescent protein (ubi:zebrabow) are transplanted into the presumptive hindbrain of shank3ab−/− mutant recipient embryos at mid-gastrulation stages. b Chimeric embryos at 1 day post-fertilization (dpf), with donor cells expressing the fluorescent protein (false-colored in cyan) in recipient shank3abΔN−/− or shank3abΔC−/− embryos. Chimeric six-day-old larvae (shank3ab−/−:Zb-T) were imaged to determine the fate of the transplanted cells. c Confocal images of chimeric larvae at 6 dpf following behavioral screening, demonstrating transplanted cells in rescued larvae populate the dorsal/rostral brainstem nuclei. Individual representative larvae are numbered 1-3, with the three averaged in the right most stack. d VMR line graphs, median +/− SE, (d–f) and (e) paired dot plots show lights-off behavioral phenotypes are rescued in both shank3abΔ−/− mutant models with wild-type-derived brain stems (shank3abΔ−/−:Zb-T). Exact sample sizes of biologically independent samples for each genotype and chimera are indicated below each plot and also apply to d and f. Within shank3 model comparisons were conducted using Dunn–Bonferroni p-value corrected t-tests. f Box plots displaying median swimming distances for individuals following the first 30 s following lights-off. Individual values are medians representing all four lights-off transitions for individual larvae. Boxes denote the median, 1st and 3rd quartile, while whiskers represent the minimum and maximum values. Groups were statistically compared using Kruskal-Wallis one-way ANOVA, and when p < 0.05, were followed by Dunn’s multiple comparisons. P-value asterisks represent; p < 0.05 - *, p < 0.01 - **, p < 0.001 - ***, p < 0.0001-****. Scale bars = 100 µm (b); 50 µm (c). Source data for plots are provided in Supplementary Data 2. |