
Fig. 1
- ID
- ZDB-FIG-220131-75
- Publication
- Kozol et al., 2021 - Restoring Shank3 in the rostral brainstem of shank3ab-/- zebrafish autism models rescues sensory deficits
- Other Figures
- All Figure Page
- Back to All Figure Page
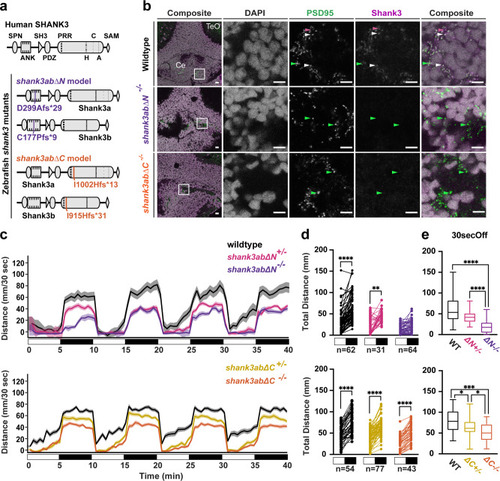
a Shank3 protein diagrams of human SHANK3 and duplicated zebrafish Shank3a and Shank3b show where in the zebrafish proteins four independent CRISPR-Cas 9 indel alleles introduce frameshift mutations. Protein interaction domains indicated in human SHANK3 are more highly conserved in zebrafish Shank3a than Shank3b (SPN = Shank/ProSAP N-terminal, ANK = ankyrin repeats, SH = SRC Homology 3, PDZ = post-synaptic density protein/disc large/zonula occludens-1, PRR = proline-rich region that includes interaction domains with H = Homer, C = cortactin, A = actin binding protein 1, and SAM = sterile alpha motif). Each shank3abΔN (purple) and shank3abΔC (orange) mutant model has similar mutations in Shank3a and Shank3b paralogs: shank3abΔN mutations are in ankyrin repeat regions and shank3abΔC mutations are in the proline-rich region. b Coronal cryosections from 6dpf larvae were stained with antibodies against the glutamatergic post-synaptic scaffolding proteins PSD-95 and Shank3, with a representative sample shown for each genotype. Synapses in wild-type cerebellum (Ce) stain for both PSD-95 (green arrowheads) and Shank3 (magenta arrowheads) puncta, some of which colocalize (white arrowheads), compared to shank3ab mutants that stain for PSD-95, but not Shank3. TeO= Optic Tectum; Scale bars represent 10 µm. c Visual motor responses (VMR) are shown as line graphs of median distance traveled in 30 s ±SE to four cycles of lights-on to lights-off transitions. White and black boxes below the x-axis indicate alternating lights-on and lights-off, respectively. Exact sample sizes of biologically independent samples are indicated below the Paired dot plots and apply to plots in (c–e). d Paired dot plots compare median swimming distances per larva of the four light transitions in the 30 s before and after the lights-on to lights-off transition. Within genotype comparisons were conducted using Dunn-Bonferroni p-value corrected t-tests (e) Box plots compare distance traveled during the first 30 s of dark between WT and shank3ab mutant models. Boxes denote the median, 1st and 3rd quartile, while whiskers represent the minimum and maximum values. Groups were statistically compared using a Kruskal–Wallis ANOVA, and when p < 0.05, were followed by a Dunn’s multiple comparison test. P-value asterisks represent; p < 0.05 - *, p < 0.01 - **, p < 0.001 - ***, p < 0.0001-****. Source data for plots are provided in Supplementary Data 2. |