
Fig. 1
- ID
- ZDB-FIG-220131-401
- Publication
- Uribe-Salazar et al., 2022 - Evaluation of CRISPR gene-editing tools in zebrafish
- Other Figures
- All Figure Page
- Back to All Figure Page
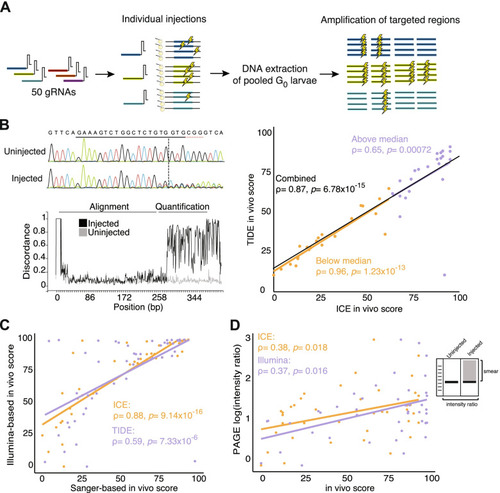
Workflow for the evaluation of CRISPR cleavages in NHGRI-1 zebrafish embryos. A The cartoon depicts our experiment, which included 50 gRNAs individually microinjected into one-cell stage embryos, DNA extracted from 20 pooled G0 larvae, and genomic regions targeted by the gRNA amplified. Lightning symbols represent a cleavage event. B An in vivo score was obtained from the Sanger sequencing traces using the ICE and TIDE tools, with an example output from ICE pictured. Scores for the two tools were plotted with values below the median in orange and above the median in purple. C Scores from ICE and TIDE tools were compared to mosaicism percentages from Illumina sequencing of the same regions. D From PAGE, an empirical intensity ratio was obtained and compared to the in vivo scores from Illumina and Sanger sequencing (ICE). Spearman correlation results are shown in the scatter plots with the line of best fit included |