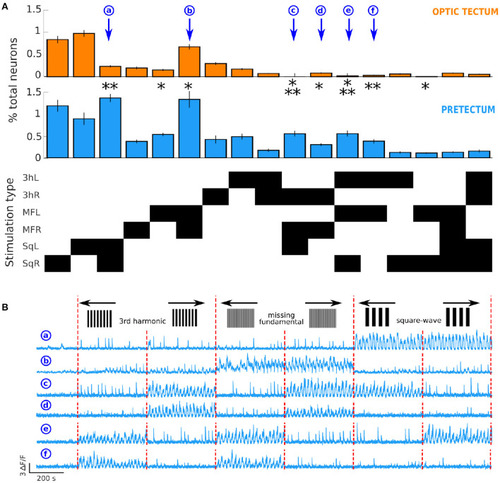
Differences in neuronal response types in the optic tectum and the pretectum. (A) Top: proportion of neurons responsive to the different types of presented stimuli in the optic tectum (n = 13) and Middle: in the pretectum (n = 7). Bottom: The response types that involved ≥ 0.1% of the total recorded neurons in the optic tectum or the pretectum. The stimulation types are represented on the y axis, the black rectangles indicate the type of stimulation represented in top and middle panels. 3hL: 3rd harmonic signal to the left; 3hR: 3rd harmonic signal to the right; MFL: missing-fundamental signal to the left; MFR: missing-fundamental signal to the right; SqL: square-wave signal to the left; SqR: square-wave signal to the right. Wilcoxon rank sum test corrected with the false discovery rate: *p ≤ 0.05, **p ≤ 0.01, ***p ≤ 0.001. Values as means±S.D.: Response to SqL and SqR (a): pretectum 1.34 ± 0.18% of all recorded pretectal neurons, optic tectum 0.24 ± 0.05% of all recorded tectal neurons, p = 0.002. Response to MFL: pretectum 0.52 ± 0.08%, optic tectum 0.16 ± 0.05%, p = 0.014. Response to MFL and MFR (b): pretectum 1.31 ± 0.99%, optic tectum 0.68 ± 0.43%, p = 0.046. Response to 3hR, MFR and SqL (c): pretectum 0.54 ± 0.13%, optic tectum 0 neurons, p = 5.10-4. Response to 3hR and MFR (d): pretectum 0.30 ± 0.06%, optic tectum 0.08 ± 0.03%, p = 0.018. Response to 3hL, MFL and SqR (e): pretectum 0.54 ± 0.13%, optic tectum 0.02 ± 0.02%, p = 7.10-4. Response to 3hL and MFL (f): pretectum 0.37 ± 0.10%, optic tectum 0.03 ± 0.02%, p = 0.006. Response to MFL and SqR: pretectum 0.11 ± 0.09%, optic tectum 0.01 ± 0.03%, p = 0.014. (B) Examples of the activity of 6 neurons of the pretectum that respond, respectively to the square-wave signal moving in both directions (a), to the missing-fundamental signal moving in both directions (b), according to the behavioral output to the left (c, 3rd harmonic and missing-fundamental signals to the right and square-wave signal to the left), to the 3rd harmonic and the missing-fundamental signals to the right (d), according to the behavioral output to the right (e, 3rd harmonic and missing-fundamental signals to the left and square-wave signal to the right), or to the 3rd harmonic and the missing-fundamental signals to the left (f). Vertical red dashed lines separate the different types of presented stimuli.
|
