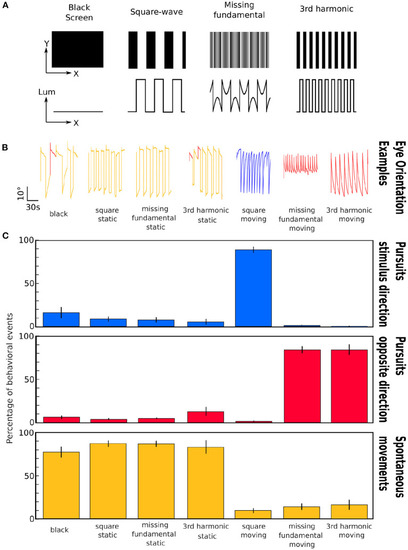
Representation of the different stimuli and induced eye movements. (A) Images corresponding to the different stimuli projected to the larvae. First row: visual appearance of the stimuli; Second row: Plot of the luminance as a function of spatial position across the x axis. (B) Examples of the eye orientation traces induced by the different types of visual stimuli: black screen, static square-wave signal, static missing-fundamental signal, static 3rd harmonic signal, moving square-wave signal, moving missing-fundamental signal and moving 3rd harmonic signal. Yellow: spontaneous movements; blue: pursuits in the stimulus direction; red: pursuits in the opposite direction. (C) Percentage of behavioral events (pursuits in the direction of the stimulus' motion, pursuits in the opposite direction, spontaneous rotations) for the seven presented stimuli. The error bars represent the standard error of the mean. The behavioral experiment was performed on n = 6 larvae. Values as means±S.D.: Black: stimulus direction 16.3 ± 15.8%; opposite direction 6.3 ± 5.0%; spontaneous 77.4 ± 15.7%; p_anova = 2.10-7. Static square-wave: stimulus direction 8.9 ± 6.9%; opposite direction 4.0 ± 2.7%; spontaneous 87.1 ± 8.7%; p_anova = 8.10-13. Static missing-fundamental: stimulus direction 8.0 ± 7.5%; opposite direction 5.1 ± 1.7%; spontaneous 86.9 ± 8.3%; p_anova=8.10-13. Static 3rd harmonic stimulus: stimulus direction 5.4 ± 7.9%; opposite direction 12.6 ± 12.4%; spontaneous 82.0 ± 19.0%; p_anova = 1.10-7. Moving square-wave: stimulus direction 89.0 ± 8.7%; opposite direction 1.1 ± 1.8%; spontaneous 9.9 ± 7.3%; p_anova=5.10-13. Moving missing-fundamental: stimulus direction 1.4 ± 1.8%; opposite direction 84.2 ± 9.9%; spontaneous 14.4 ± 9.2%; p_anova = 2.10-11. Moving 3rd harmonic stimulus: stimulus direction 0.6 ± 1.5%; opposite direction 83.7 ± 15.0%; spontaneous 15.7 ± 14.3%; p_anova = 8.10-9. See also Supplementary Table 2 for more detailed statistical values.

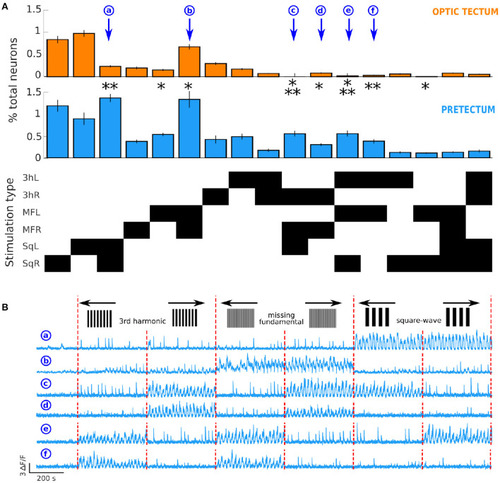
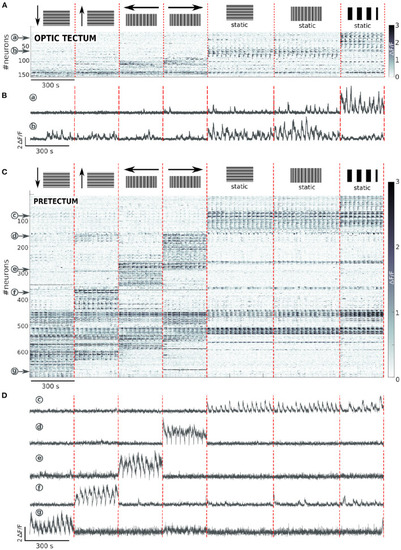
Tectal and pretectal neuronal representation of the visual stimuli. (A) Raster of activity of the neurons responding to at least one of the presented stimuli in the optic tectum (n = 13 larvae). The imaged frames are sorted on the x axis so that stimuli of the same type are grouped together (separated by vertical red dashed lines). The neurons are sorted on the y axis according to the type of response they display (separated by horizontal blue dashed lines). Note that the frequency in the Ca2+ signal observed during the presentation of the stimulus is due to the alternation between static and moving stimuli. (B) Examples of the neuronal responses of 5 neurons of the optic tectum induced by the square-wave stimulus to the right (a), or the left (b), the missing-fundamental stimulus in both directions (c), the 3rd harmonic stimulus to the right (d), or the left (e). (C) Same as (A) but for the pretectum (n = 7 larvae). (D) Examples of the stimulus-induced activity of 6 neurons in the pretectum that responded to the square-wave stimulus in both directions (f), to the missing-fundamental stimulus in both directions (g), to the 3rd harmonic stimulus to the right (h), or to the left (i), according to the behavioral output to the left (j, 3rd harmonic and missing-fundamental stimuli to the right and square-wave stimulus to the left), according to the behavioral output to the right (k, 3rd harmonic and missing-fundamental stimuli to the left and square-wave stimulus to the right).

Differences in neuronal response types in the optic tectum and the pretectum. (A) Top: proportion of neurons responsive to the different types of presented stimuli in the optic tectum (n = 13) and Middle: in the pretectum (n = 7). Bottom: The response types that involved ≥ 0.1% of the total recorded neurons in the optic tectum or the pretectum. The stimulation types are represented on the y axis, the black rectangles indicate the type of stimulation represented in top and middle panels. 3hL: 3rd harmonic signal to the left; 3hR: 3rd harmonic signal to the right; MFL: missing-fundamental signal to the left; MFR: missing-fundamental signal to the right; SqL: square-wave signal to the left; SqR: square-wave signal to the right. Wilcoxon rank sum test corrected with the false discovery rate: *p ≤ 0.05, **p ≤ 0.01, ***p ≤ 0.001. Values as means±S.D.: Response to SqL and SqR (a): pretectum 1.34 ± 0.18% of all recorded pretectal neurons, optic tectum 0.24 ± 0.05% of all recorded tectal neurons, p = 0.002. Response to MFL: pretectum 0.52 ± 0.08%, optic tectum 0.16 ± 0.05%, p = 0.014. Response to MFL and MFR (b): pretectum 1.31 ± 0.99%, optic tectum 0.68 ± 0.43%, p = 0.046. Response to 3hR, MFR and SqL (c): pretectum 0.54 ± 0.13%, optic tectum 0 neurons, p = 5.10-4. Response to 3hR and MFR (d): pretectum 0.30 ± 0.06%, optic tectum 0.08 ± 0.03%, p = 0.018. Response to 3hL, MFL and SqR (e): pretectum 0.54 ± 0.13%, optic tectum 0.02 ± 0.02%, p = 7.10-4. Response to 3hL and MFL (f): pretectum 0.37 ± 0.10%, optic tectum 0.03 ± 0.02%, p = 0.006. Response to MFL and SqR: pretectum 0.11 ± 0.09%, optic tectum 0.01 ± 0.03%, p = 0.014. (B) Examples of the activity of 6 neurons of the pretectum that respond, respectively to the square-wave signal moving in both directions (a), to the missing-fundamental signal moving in both directions (b), according to the behavioral output to the left (c, 3rd harmonic and missing-fundamental signals to the right and square-wave signal to the left), to the 3rd harmonic and the missing-fundamental signals to the right (d), according to the behavioral output to the right (e, 3rd harmonic and missing-fundamental signals to the left and square-wave signal to the right), or to the 3rd harmonic and the missing-fundamental signals to the left (f). Vertical red dashed lines separate the different types of presented stimuli.

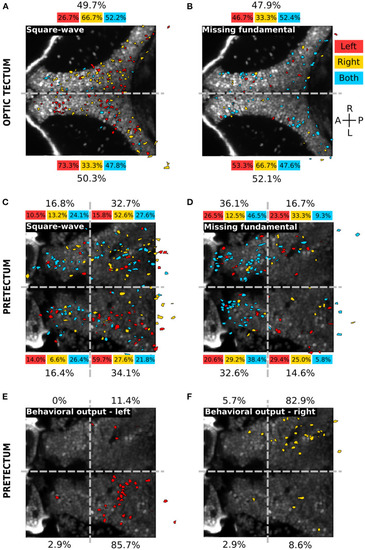
Spatial distribution of the different neuronal response types in the optic tectum and the pretectum. (A) Spatial distribution of the neurons responding to the square-wave signal to the left (red), to the right (yellow) or to both directions (cyan), in the optic tectum (n = 13). The percentages on top and bottom indicate the proportion of responsive neurons in the right and left hemispheres, for the responses to the left (red), to the right (yellow), to both directions (cyan) or in global for the square-wave stimulus (black). Gray dashed line: midline. (B) Same as (A) for the missing-fundamental signal. Note that the responses to both left and right directions of the missing-fundamental signal (cyan) are mostly induced by the static missing-fundamental stimulus (Supplementary Figure 3A). (C) Spatial distribution of the neurons responding to the square-wave signal to the left (red), to the right (yellow) or to both directions (cyan) in the pretectum (n = 7). The percentages next to each quadrant indicate the proportion of responsive neurons in each region, for the responses to the left (red), to the right (yellow), to both directions (cyan) or in global for the square-wave stimulus (black). Gray dashed horizontal line: midline. Gray dashed vertical line: separates between the anterior and posterior part of the pretectum. (D) Same as (C) for the missing-fundamental signal. Note that the responses to both left and right directions of the missing-fundamental signal (cyan) are mostly induced by the static missing-fundamental stimulus (Supplementary Figure 3B). (E) Same as (C) according to the behavioral output to the left (response to 3rd harmonic and missing-fundamental signals to the right and square-wave signal to the left). (F) Same as (C) according to the behavioral output to the right (response to 3rd harmonic and missing-fundamental signals to the left and square-wave signal to the right).

Tectal and pretectal neuronal representation of different directions of the missing-fundamental stimulus. (A) Raster of activity of the neurons responding to at least one of the 4 directions of the missing-fundamental signal, or to the static missing-fundamental or square-wave, in the optic tectum (n = 6 larvae). The imaged frames are sorted on the x axis so that stimuli of the same type are grouped together (separated by vertical red dashed lines). The neurons are sorted on the y axis according to the type of response they display (separated by horizontal blue dashed lines). (B) Examples of the activity of 2 neurons in the optic tectum that respond, respectively to the static square-wave signal (a), or to the static horizontal and vertical missing-fundamental (b). (C) Same as (A) for the pretectum (n = 6). (D) Examples of the activity of 5 neurons in the pretectum that respond, respectively to the static vertical and horizontal missing-fundamental signal and the static square-wave signal (c), or to the missing-fundamental signal going to the right (d), to the left (e), up (f) or down (g).

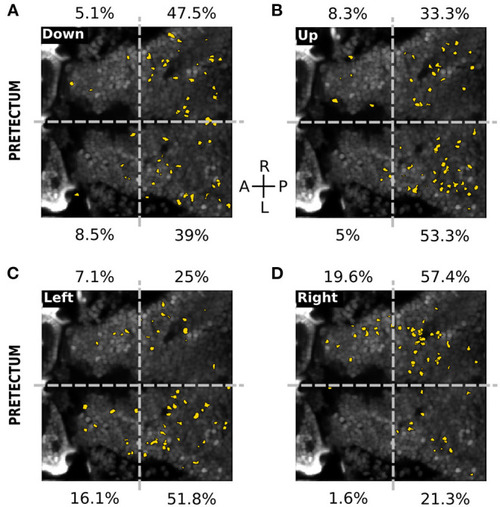
Spatial distribution of neurons responding to the directions of the missing-fundamental signal in the pretectum. (A) Spatial distribution of the neurons (yellow) responding to the horizontal missing-fundamental signal moving downwards in the pretectum. The percentages next to each quadrant indicate the proportion of responsive neurons in each region. Gray dashed horizontal line: midline. Gray dashed vertical line: separates between the anterior and posterior part of the pretectum. (B) Same as (A) for the horizontal missing-fundamental signal moving upwards. (C) Same as (A) for the vertical missing-fundamental signal moving leftwards. (D) Same as (A) for the vertical missing-fundamental signal rightwards.

Acknowledgments
This image is the copyrighted work of the attributed author or publisher, and ZFIN has permission only to display this image to its users. Additional permissions should be obtained from the applicable author or publisher of the image. Full text @ Front. Neural Circuits