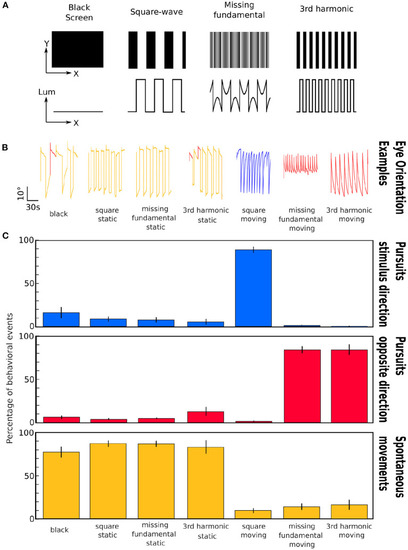
Representation of the different stimuli and induced eye movements. (A) Images corresponding to the different stimuli projected to the larvae. First row: visual appearance of the stimuli; Second row: Plot of the luminance as a function of spatial position across the x axis. (B) Examples of the eye orientation traces induced by the different types of visual stimuli: black screen, static square-wave signal, static missing-fundamental signal, static 3rd harmonic signal, moving square-wave signal, moving missing-fundamental signal and moving 3rd harmonic signal. Yellow: spontaneous movements; blue: pursuits in the stimulus direction; red: pursuits in the opposite direction. (C) Percentage of behavioral events (pursuits in the direction of the stimulus' motion, pursuits in the opposite direction, spontaneous rotations) for the seven presented stimuli. The error bars represent the standard error of the mean. The behavioral experiment was performed on n = 6 larvae. Values as means±S.D.: Black: stimulus direction 16.3 ± 15.8%; opposite direction 6.3 ± 5.0%; spontaneous 77.4 ± 15.7%; p_anova = 2.10-7. Static square-wave: stimulus direction 8.9 ± 6.9%; opposite direction 4.0 ± 2.7%; spontaneous 87.1 ± 8.7%; p_anova = 8.10-13. Static missing-fundamental: stimulus direction 8.0 ± 7.5%; opposite direction 5.1 ± 1.7%; spontaneous 86.9 ± 8.3%; p_anova=8.10-13. Static 3rd harmonic stimulus: stimulus direction 5.4 ± 7.9%; opposite direction 12.6 ± 12.4%; spontaneous 82.0 ± 19.0%; p_anova = 1.10-7. Moving square-wave: stimulus direction 89.0 ± 8.7%; opposite direction 1.1 ± 1.8%; spontaneous 9.9 ± 7.3%; p_anova=5.10-13. Moving missing-fundamental: stimulus direction 1.4 ± 1.8%; opposite direction 84.2 ± 9.9%; spontaneous 14.4 ± 9.2%; p_anova = 2.10-11. Moving 3rd harmonic stimulus: stimulus direction 0.6 ± 1.5%; opposite direction 83.7 ± 15.0%; spontaneous 15.7 ± 14.3%; p_anova = 8.10-9. See also Supplementary Table 2 for more detailed statistical values.
|
