
Fig 3
- ID
- ZDB-FIG-220131-165
- Publication
- Yang et al., 2022 - Dominating lengthscales of zebrafish collective behaviour
- Other Figures
- All Figure Page
- Back to All Figure Page
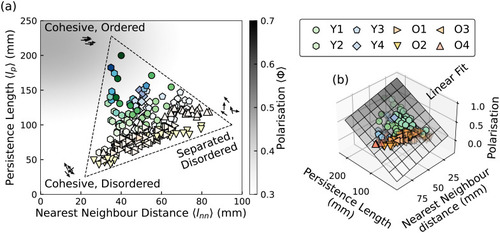
A: The states of the fish represented by the nearest neighbour distance and the persistence length. The brightness of the markers corresponds to the value of the polarisation. Each scatter–point corresponds to a time-average of 2 minutes. Different shapes indicate different fish groups from different experiments. B: A multilinear regression model fitting the relationship between the polarisation and the two length scales, indicating the polarisation increase with the increase of persistence length, and the decrease of the nearest neighbour distance. The model is rendered as a 2D plane, whose darkness indicates the value of polarisation. |