
Fig 1
- ID
- ZDB-FIG-220131-162
- Publication
- Yang et al., 2022 - Dominating lengthscales of zebrafish collective behaviour
- Other Figures
- All Figure Page
- Back to All Figure Page
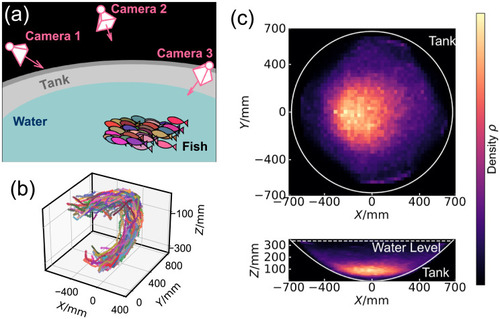
A: Schematic illustration of the experimental setup. Zebrafish were transferred into a bowl-shaped tank and three cameras were mounted above the air-water interface to record the trajectories of the fish. B: 3D trajectories obtained from the synchronised videos of different cameras. These trajectories belong to 50 young zebrafish (group Y1) in 10 seconds. C: The spatial distribution of 50 young fish (Y1) during a one-hour observation. Brighter colour indicates higher density. The top panel shows the result in XY plane, obtained from a max-projection of the full 3D distribution. The bottom panel shows a max-projection in the XZ plane. The outline of the tank and water-air interface, obtained from 3D measurement, are labelled. |