|
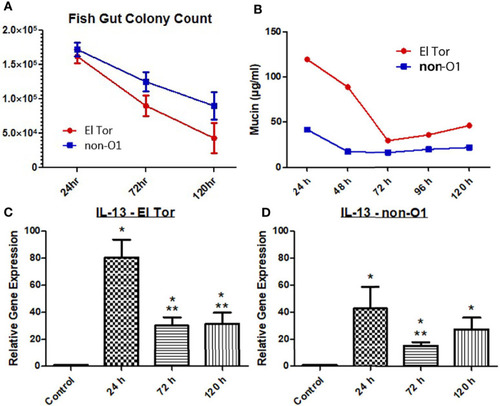
Mucin and IL-13 levels increase during V. cholerae infection. WT zebrafish (n=5) were infected with E7946 (El Tor) or 25493 (non-O1) strains of V. cholerae at 2.5 x 10⁷ CFU/mL and then sacrificed at the indicated time points, or water was taken during indicated time points. (A) CFU of the indicated V. cholerae strain taken from zebrafish intestines. (B) Mucin levels in the water of zebrafish infected with the indicated V. cholerae strain. (C) IL_13 expression in fish infected with El Tor strain E7946. (D) IL-13 levels in fish infected with non-O1 strain 25493. Mucin levels were determined via microtiter PAS assay. mRNA levels were determined through qRT-PCR. Gene expression was normalized against β-actin and expressed as fold change. Error bars indicate standard deviation. Data shown is from three experiments. *P < 0.05 as compared to control, **P < 0.05 as compared to 24 h infection.
|