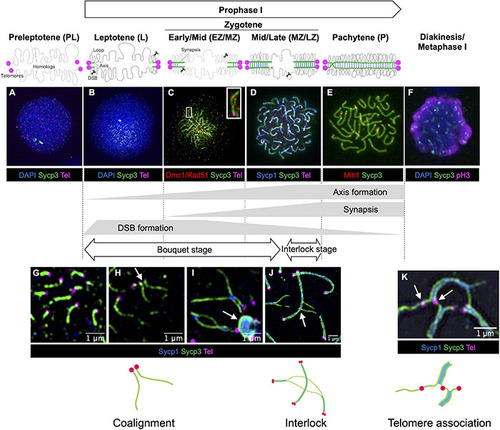
Stages of meiotic prophase I in zebrafish. Immunofluorescence staining of synaptonemal complex protein 3 (Sycp3) with telomeres (Tel), DNA (DAPI) and/or stage specific markers on zebrafish spermatocyte spreads observed by conventional immunofluorescence microscopy (A–F) and by super resolution microscopy (G–K). Diagrams of homologous chromosome pairs (gray lines) indicate axis formation (green lines) and synapsis (blue lines) from telomeres (circles in magenta). (A) In the preleptotene stage, telomeres are yet to cluster and aggregates of Sycp3 are observed. (B) In the leptotene stage, telomeres cluster in the bouquet and axis formation as seen by the formation of Sycp3 lines immediately adjacent to telomeres. (C) DSBs near telomeres in leptotene and early/mid-zygotene (EZ/MZ) stages, visualized by staining DNA recombinases (Dmc1/Rad51; adapted from Takemoto et al., 2020). A region marked as a white rectangle is shown at a higher magnification at the top right. (D) Synapsis between homologs visualized by synaptonemal complex protein 1 (Sycp1) staining in a mid- to late zygotene (MZ/LZ) nucleus. (E) In the pachytene stage, axis formation and synapsis are completed and chromosomes are aligned from end-to-end. Future crossover sites are visualized by staining of MutL homolog 1 (Mlh1), which is involved in DSB repair. (F) A phosphohistone H3 (pH3) positive nucleus with broken Sycp3 signals. (G) Axes originate from telomere regions. (H) Coaignment between homologs, as indicated by parallel segments of axes (arrow). (I) Synapsis initiates between end regions. Telomeres are often seen associated with polycomplexes made up of Sycp3 and Sycp1 proteins (arrow). (J) End-to-end synapsis can result in interlocks where one or two chromosomes (in this case two synapsed homologs) can be trapped between another synapsed pair (arrow). Interlocks are often seen with local regions of asynapsis. (K) Telomere associations can persist into zygotene (shown here) and pachytene (not shown) although their numbers are reduced. Sometimes a stretch of axis can be seen spanning the ends of two unrelated chromosomes (arrow). Schematic diagrams of chromosome configurations are shown at the bottom. In (A,B,F) blue indicates DAPI stained DNA while in (D,G–J) blue indicates Sycp1 protein. (C) Is adapted from Takemoto et al. (2020). (F) Is modified from Ozaki et al. (2011). (G–I) Were previously published in Blokhina et al. (2019). (A,B,D,E,J) Replicate previously published images.
|
