
FIGURE
FIGURE 3
- ID
- ZDB-FIG-211029-61
- Publication
- Fasil et al., 2021 - Selenium and Zinc Oxide Multinutrient Supplementation Enhanced Growth Performance in Zebra Fish by Modulating Oxidative Stress and Growth-Related Gene Expression
- Other Figures
- All Figure Page
- Back to All Figure Page
FIGURE 3
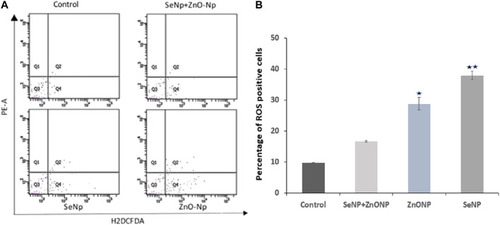
Intracellular ROS analysis in adult zebra fish using flow cytometry: |
Expression Data
Expression Detail
Antibody Labeling
Phenotype Data
Phenotype Detail
Acknowledgments
This image is the copyrighted work of the attributed author or publisher, and
ZFIN has permission only to display this image to its users.
Additional permissions should be obtained from the applicable author or publisher of the image.
Full text @ Front Bioeng Biotechnol