
- Title
-
Selenium and Zinc Oxide Multinutrient Supplementation Enhanced Growth Performance in Zebra Fish by Modulating Oxidative Stress and Growth-Related Gene Expression
- Authors
- Fasil, D.M., Hamdi, H., Al-Barty, A., Zaid, A.A., Parashar, S.K.S., Das, B.
- Source
- Full text @ Front Bioeng Biotechnol
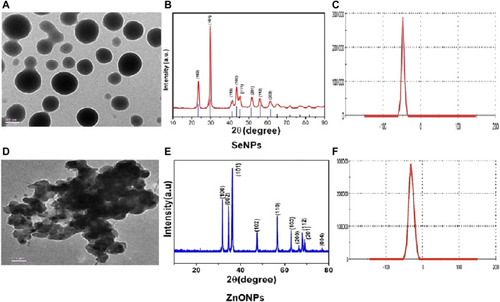
Physicochemical characterization showing the representative images of TEM |
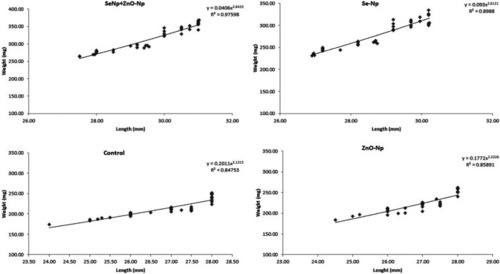
Length–weight relationship of adult zebra fish in the four groups: SeNPs + ZnONPs, SeNPs, ZnONPs, and control, showing R2 as the critical growth parameter value. |
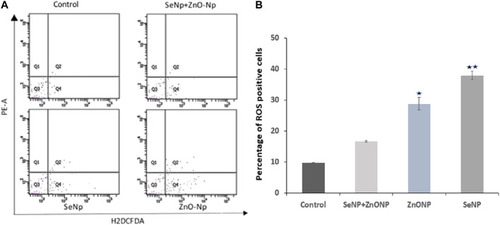
Intracellular ROS analysis in adult zebra fish using flow cytometry: |
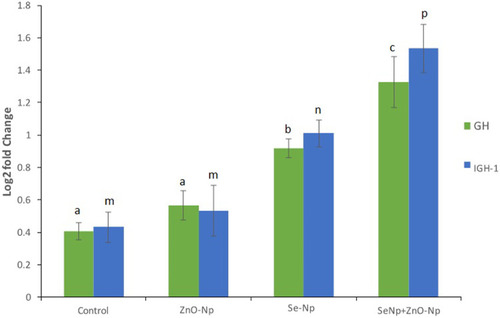
qRT-PCR bar graphs showing the log2 fold change in the growth-related genes growth hormone (GH), and insulin-like growth factor-1 (IGF-1) expression in the different groups, showing significantly upregulation in the SeNPs + ZnONPs group compared to all groups ( |
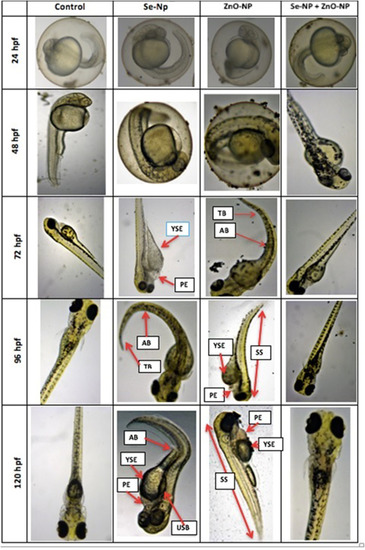
FIGURE 5. Morphological analysis of zebra fish embryos obtained from the four different groups (Control, SeNPs, ZnONPs, and SeNPs + ZnONPs). The structural deformities are shown in arrows: SC: spinal curvature, TM: tail malformation, PE: pericardial edema, YSE: yolk sac edema, USB: uninflated swim bladder, AX: axis (scoliosis), TB: tail bending, and SS: small size (dwarf). |
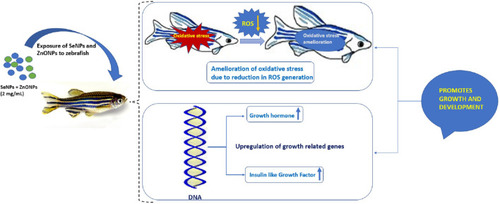
FIGURE 6. Mechanistic diagram delineating the effect of combined use of SeNP and ZnONPs on zebra fish exhibiting higher growth performance due to reduction of oxidative stress (OS) and ROS and upregulation of growth-regulated genes. |