IMAGE

FIGURE 3

ID
ZDB-IMAGE-211029-68
Source
Figures for Fasil et al., 2021
Image
Figure Caption

FIGURE 3

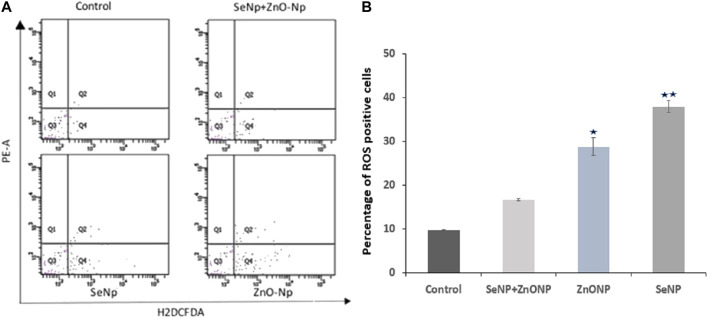
Intracellular ROS analysis in adult zebra fish using flow cytometry: (A) Q4 represents the intracellular ROS level measured by H2DCFDA fluorescence dye.(B) Bar graph showing the percentage of ROS + cells (Q4 quadrant of the flow cytometric graph) in the four different groups. Significantly low mean value ± SD of ROS + cells were found (p < 0.05) in both ZnONP and SeNP groups compared to control and ZnONP + SeNP groups. *p < 0.05 denote significant variation from control embryos as obtained by ANOVA analysis.

Acknowledgments
This image is the copyrighted work of the attributed author or publisher, and ZFIN has permission only to display this image to its users. Additional permissions should be obtained from the applicable author or publisher of the image. Full text @ Front Bioeng Biotechnol