
Fig. 2
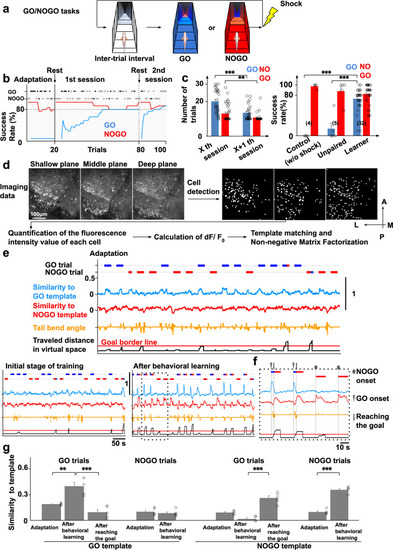
a GO/NOGO tasks in the virtual reality system. b The learning curve of GO/NOGO trials of a fish that met the behavioral learning criterion. Horizontal dotted line, the criterion for behavioral learning; open circles, successful trials; solid circles, failed trials; vertical line, the initiation time point of trials with electric shock; vertical dotted line, the initiation of the next session. c Left: the number of trials needed until the behavioral learning criterion of GO and NOGO trials was satisfied in the Xth session and the next X + 1th session (32 fish). Xth GO vs X + 1th GO, ***P = 7.72 × 10⁻⁶; Xth NOGO vs X + 1th NOGO, **P = 4.03 × 10⁻³. Two-tailed paired t-test. Right: Comparison of the success rates among control, unpaired, and learner groups at the 22nd GO trial and16th NOGO trial which were the average numbers needed to achieve the behavior criteria in standard learner fish. Control (w/o shock) vs learner, ***P = 7.52 × 10⁻⁸; unpaired vs learner, ***P = 2.27 × 10⁻⁶, two-tailed unpaired t-test. Columns and error bars: mean ± SEM. Each circle represents one fish. The numbers in parentheses are the number of fish used in the statistics. d Imaging data analysis procedure. See “Methods” for details. e Similarity to GO and NOGO templates in the adaptation stage (upper panel), initial stage of training (bottom left panel), and after the establishment of behavioral learning (bottom right panel). Horizontal bars in the upper and lower positions indicate the period of GO and NOGO trials, respectively. The bar colors indicate the color of the environment at the position of the fish. f Enlarged view of the boxed area in (e, bottom right panel). g Comparison of peak value of the similarities to both GO and NOGO templates in both trials in the adaptation stage, after behavioral learning, and after reaching the goal after behavioral learning. Columns and error bars: mean ± SEM. Circles in the adaptation stage and after behavioral learning indicate peak similarities when the fish was in the start color in the first five trials. Circles after reaching the goal indicate peak similarities after fish reached the goal in the first five GO trials after behavioral learning. Adaptation vs after behavioral learning in GO trials GO template, **P = 1.56 × 10⁻³; after behavioral learning vs after reaching the goal in GO trials GO template, ***P = 4.5 × 10⁻⁴; after behavioral learning vs after reaching the goal in GO trials NOGO template, ***P = 5.02 × 10⁻⁵; adaptation vs after behavioral learning in NOGO trials NOGO template, ***P = 1.56 × 10⁻⁶. Two-tailed unpaired t-test. |