
Fig. 1
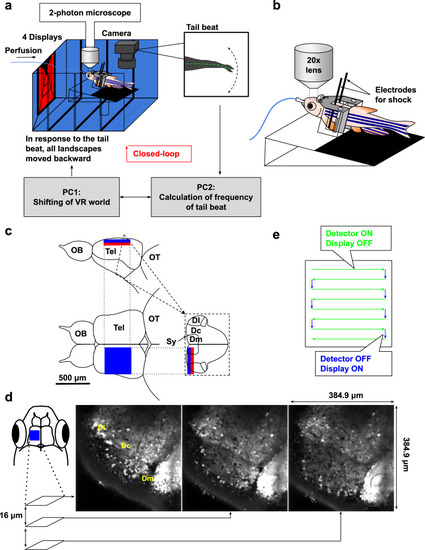
a Schematic diagram of the closed-loop virtual reality setup. Four displays presented visual stimuli. Tail beating was captured by a camera and caused the scenery to move backward to create the impression of forward swimming. The virtual traveling distance was calculated by [frequency of tail beats] × [gain]. b Schematic drawing of the tethered adult zebrafish using a custom-made harness, dental bond, and cement. Two needle electrodes were placed on both sides of the body to deliver electric shocks. c The imaged region in the telencephalon. The side (top) and dorsal (bottom left) views and coronal section (bottom right) of the adult zebrafish brain. The blue box indicates the imaged region by surface three-plane imaging, and the red box indicates the additionally imaged region by six-plane imaging. Dc, central zone of dorsal telencephalic area; Dl, lateral zone of dorsal telencephalic area; Dm, medial zone of dorsal telencephalic area; OB, olfactory bulb; OT, optic tectum; Sy, sulcus ypsiloniformis; Tel, telencephalon. d Calcium imaging of neural activity in three focal planes using the piezo actuator. Either left or right hemisphere was imaged. These images are averaged images of the left hemisphere in three focal planes. Anterior to top; lateral to left; medial to right. Dl, lateral zone of the dorsal telencephalon; Dc, central zone of dorsal telencephalon; Dm, medial zone of dorsal telencephalon10. e Schema of alternate switching of neural activity detection by a two-photon microscope and visual stimulation by displays. Green arrows indicate the duration of scanning; in this setting, the detector is ON and displays are OFF. Blue arrows indicate the duration from the end of a line scan to the onset of the next line scan; in this setting, the detector is OFF and displays are ON. |