
Figure 4
- ID
- ZDB-FIG-211011-9
- Publication
- Zang et al., 2021 - Circadian regulation of vertebrate cone photoreceptor function
- Other Figures
- All Figure Page
- Back to All Figure Page
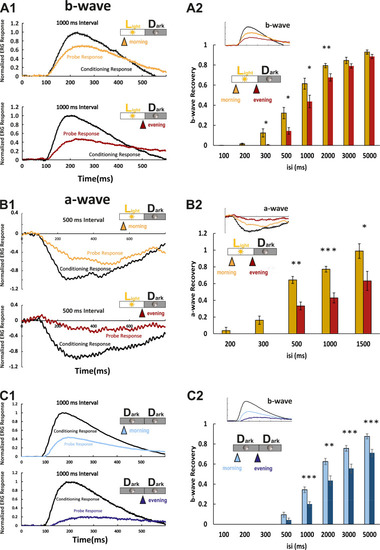
(A1) Examples of normal light/dark (LD) larval electroretinogram (ERG) b-wave recordings. A conditioning flash (black line) was followed by a probing flash (yellow and red lines), which were separated by 1000 ms. While the yellow triangle and curve mark the probe response in the morning, the red triangle and curve represent the probe response recorded in the evening. Note that the probe response in the evening is clearly diminished. (A2) b-wave recovery as a function of the interstimulus interval (isi). At 500 ms up to 3000 ms isi, b-wave recovery in the morning (yellow bars) is significantly enhanced when compared to corresponding recordings in the evening (red bars). Note that below 500 ms isi, no b-wave recovery can be observed and that at an interval of 5 s complete recovery can also be found in the evening. Data are presented as mean ± sem (n = 18 in the morning; n = 14 in the evening) of three independent experiments. t-tests and nonparametric tests were performed by GraphPad Prism version 8. p = 0.0149 at 300 ms isi; p = 0.0151 at 500 ms isi; p = 0.0405 at 1000 ms isi; p = 0.0069 at 2000 ms isi. *p<0.05; **p<0.01. (B1) Examples of LD larval ERG a-wave recordings under DL-threo-beta-benzyloxyaspartate (DL-TBOA) and L-2-amino-4-phosphonobutyric acid (L-AP4) inhibition. Under b-wave blocking conditions, a conditioning flash (black line) was followed by a probing flash (yellow and red lines), which were separated by 500 ms. The yellow triangle and curve mark the probe response in the morning, whereas the red triangle and curve represent the probe response recorded in the evening. Note that also the a-wave response recovery is significantly reduced in the evening. (B2) a-wave recovery as a function of isi. At 300 ms up to 1500 ms isi, a-wave recovery in the morning (yellow bars) is significantly enhanced when compared to corresponding recordings in the evening (red bars). Data are presented as mean ± sem (n = 11 in the morning; n = 5 in the evening) of three independent experiments. t-tests and nonparametric tests were performed by GraphPad Prism version 8. Plots with individual data points were provided in metadata from DRYAD. p = 0.0029 at 500 ms isi; p = 0.0003 at 1000 ms isi; p = 0.0375 at 1500 ms isi. *p<0.05; **p<0.01; ***p≤0.001. (C1) Examples of ERG b-wave recordings from a larva kept under constant darkness (DD). A conditioning flash (black line) was followed by a probing flash (light and dark blue lines), which were separated by 1000 ms. The light blue triangle and curve mark the probe response in the morning, whereas the dark blue triangle and curve represent the probe response recorded in the evening. (C2) b-wave recovery as a function of the isi is shown for larvae raised in continuous darkness (DD). Even under continuous darkness, visual function remains under circadian control as at 500 ms up to 3000 ms isi, and the b-wave recovery in the morning (light blue bars) is significantly enhanced when compared to corresponding recordings in the evening (dark blue bars). Data are presented as mean ± sem (n = 17 in the morning; n = 12 in the evening) of three independent experiments. t-tests and nonparametric tests were performed by GraphPad Prism version 8. p = 0.0007 at 1000 ms isi; p = 0.0016 at 2000 ms isi; p = 0.0004 at 3000 ms isi; p = 0.0006 at 5000 ms isi. *p<0.05; **p<0.01; ***p≤0.001. Metadata can be downloaded from DRYAD. |