
Figure 7
- ID
- ZDB-FIG-211011-14
- Publication
- Zang et al., 2021 - Circadian regulation of vertebrate cone photoreceptor function
- Other Figures
- All Figure Page
- Back to All Figure Page
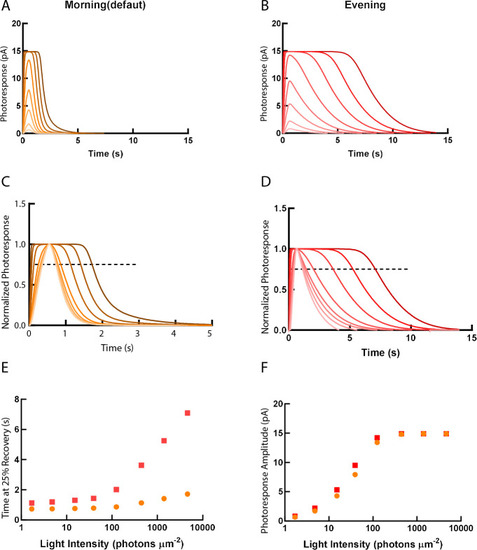
Simulations of single cone photoresponse in the morning (default) (A) and in the evening (B). 500 ms flash stimuli were delivered at time = 0 s. The flash intensities are 1.7, 4.8, 15.2, 39.4, 125, 444, 1406 and 4630 photons µm-2 (Invergo et al., 2014). (C) & (D) depict response curves normalized to the amplitudes at each light intensity. The dotted line represents 25% recovery of the photoresponse. Response duration for 25% recovery (E) and photoresponse amplitude (F) are plotted as a function of logarithmically increasing stimulus intensities.
|