
- Title
-
Circadian regulation of vertebrate cone photoreceptor function
- Authors
- Zang, J., Gesemann, M., Keim, J., Samardzija, M., Grimm, C., Neuhauss, S.C.
- Source
- Full text @ Elife
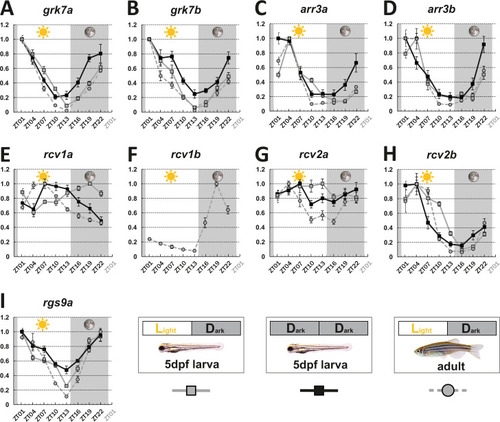
mRNA levels of visual transduction decay genes in the eye of adult and larval zebrafish were measured by qRT-PCR over a 24-hour-period. (A-I). Eye tissues from larval fish either raised under a normal light/dark cycle (LD / gray squares) or in continuous darkness (DD / black squares) and from adult LD zebrafish (gray circles) were collected at eight different time points throughout the day. The name of the analyzed gene transcripts is given on top of each graph. The time point of collection is indicated along the x-axis with ZT01 being the time point one hour after the light was turned on. Dark periods are indicated by the moon symbol and highlighted in gray, whereas the periods under regular light conditions are indicated by the sun symbol and shown in white. For better orientation the different conditions are summarized at the bottom of the figure. Data represents the mean ± standard error of the mean (s.e.m). Statistical analysis was performed by “RAIN” as previously described (Thaben and Westermark, 2014). Statistics information and the numbers of independent repeats are provided in Supplementary file 1. Metadata can be downloaded from DRYAD.
|

Transcript levels of indicated mouse genes (A-E) were measured using qRT-PCR on retinal tissue of 12-week-old wildtype mice. were measured using qRT-PCR on retinal tissue of 12-week-old wildtype mice. The time point of collection is indicated along the x-axis with ZT01 being the time point one hour after the light was turned on. Dark periods are indicated by the moon symbol and highlighted in gray, whereas the periods under regular light conditions are indicated by the sun symbol and shown in white. Data represents the mean ± s.e.m. Statistical analysis was performed by “RAIN” as previously described (Thaben and Westermark, 2014). Statistics information and the numbers of independent repeats are provided in Supplementary file 2. Metadata can be downloaded from DRYAD.
|
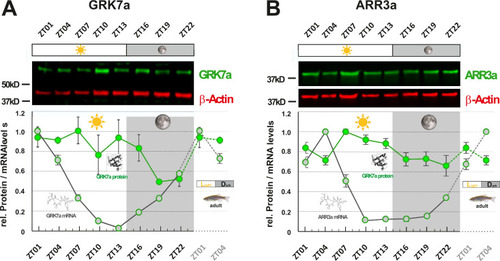
GRK7a (A) and ARR3a (B) protein levels were quantified using Western blot analysis. β-Actin was used as a loading control. While mRNA transcript levels (gray circles / RNA structure) were lowest in the evening (ZT10 and ZT13, respectively), lowest protein expression levels (green circles / protein structure) were tailing RNA expression levels by around 6 to 12 hours, reaching lowest levels in the middle of the night at around ZT19. The time point of collection is indicated along the x-axis with ZT01 being the time point one hour after the light was turned on. Dark periods are indicated by the moon symbol and highlighted in gray, whereas the periods under regular light conditions are indicated by the sun symbol and shown in white. Data represents the mean ± s.e.m. Statistical analysis was performed by “RAIN” as previously described (Thaben and Westermark, 2014). Statistics information and the numbers of independent repeats are provided in Supplementary file 3. Metadata can be downloaded from DRYAD.
|
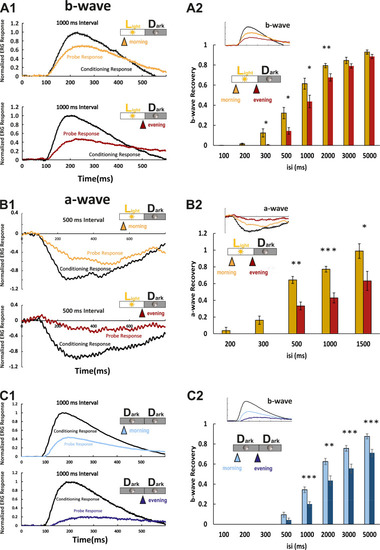
(A1) Examples of normal light/dark (LD) larval electroretinogram (ERG) b-wave recordings. A conditioning flash (black line) was followed by a probing flash (yellow and red lines), which were separated by 1000 ms. While the yellow triangle and curve mark the probe response in the morning, the red triangle and curve represent the probe response recorded in the evening. Note that the probe response in the evening is clearly diminished. (A2) b-wave recovery as a function of the interstimulus interval (isi). At 500 ms up to 3000 ms isi, b-wave recovery in the morning (yellow bars) is significantly enhanced when compared to corresponding recordings in the evening (red bars). Note that below 500 ms isi, no b-wave recovery can be observed and that at an interval of 5 s complete recovery can also be found in the evening. Data are presented as mean ± sem (n = 18 in the morning; n = 14 in the evening) of three independent experiments. t-tests and nonparametric tests were performed by GraphPad Prism version 8. p = 0.0149 at 300 ms isi; p = 0.0151 at 500 ms isi; p = 0.0405 at 1000 ms isi; p = 0.0069 at 2000 ms isi. *p<0.05; **p<0.01. (B1) Examples of LD larval ERG a-wave recordings under DL-threo-beta-benzyloxyaspartate (DL-TBOA) and L-2-amino-4-phosphonobutyric acid (L-AP4) inhibition. Under b-wave blocking conditions, a conditioning flash (black line) was followed by a probing flash (yellow and red lines), which were separated by 500 ms. The yellow triangle and curve mark the probe response in the morning, whereas the red triangle and curve represent the probe response recorded in the evening. Note that also the a-wave response recovery is significantly reduced in the evening. (B2) a-wave recovery as a function of isi. At 300 ms up to 1500 ms isi, a-wave recovery in the morning (yellow bars) is significantly enhanced when compared to corresponding recordings in the evening (red bars). Data are presented as mean ± sem (n = 11 in the morning; n = 5 in the evening) of three independent experiments. t-tests and nonparametric tests were performed by GraphPad Prism version 8. Plots with individual data points were provided in metadata from DRYAD. p = 0.0029 at 500 ms isi; p = 0.0003 at 1000 ms isi; p = 0.0375 at 1500 ms isi. *p<0.05; **p<0.01; ***p≤0.001. (C1) Examples of ERG b-wave recordings from a larva kept under constant darkness (DD). A conditioning flash (black line) was followed by a probing flash (light and dark blue lines), which were separated by 1000 ms. The light blue triangle and curve mark the probe response in the morning, whereas the dark blue triangle and curve represent the probe response recorded in the evening. (C2) b-wave recovery as a function of the isi is shown for larvae raised in continuous darkness (DD). Even under continuous darkness, visual function remains under circadian control as at 500 ms up to 3000 ms isi, and the b-wave recovery in the morning (light blue bars) is significantly enhanced when compared to corresponding recordings in the evening (dark blue bars). Data are presented as mean ± sem (n = 17 in the morning; n = 12 in the evening) of three independent experiments. t-tests and nonparametric tests were performed by GraphPad Prism version 8. p = 0.0007 at 1000 ms isi; p = 0.0016 at 2000 ms isi; p = 0.0004 at 3000 ms isi; p = 0.0006 at 5000 ms isi. *p<0.05; **p<0.01; ***p≤0.001. Metadata can be downloaded from DRYAD. |

Examples show the flicker electroretinogram (ERG) responses to 5 Hz stimulus (A1) and to 12 Hz stimulus (A2). Example fast Fourier transform (FFT) power plots generated by MATLAB for responses (A1) and (A2) are shown in (B1) and (B4). These four example power plot results are highlighted in the corresponding summarized normalized power results in (B1) and (B2). The power of given frequency was normalized against the power at 50 Hz (line noise). The rest of the summarized plots of normalized power are shown in B2, B3, and B5. t-tests and nonparametric tests were performed by GraphPad Prism version 8. p = 0.0016 at 5 Hz (B1); p = 0.0005 at 8 Hz (B2); p = 0.0001 at 10 Hz (B3); p = 0.0001 at 12 Hz (B4); p<0.0001 at 15 Hz (B5). **p<0.01; ***p≤0.001; ****p≤0.0001. Metadata can be downloaded from DRYAD.
|
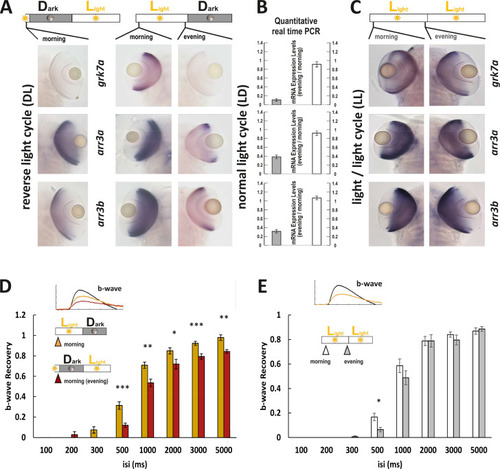
(A and C) In situ hybridization images using arr3a, arr3b, and grk7a as probes. Tissues were collected from either reverse light cycle (DL) (A, left panel), normal light cycle (LD) (A, right panel) or light/light cycle (LL) (C) zebrafish larva (5 days post fertilization [dpf]) at the indicated time points. A reversal in the light cycle from LD to DL is reflected in the reversal of the in situ hybridization signal, with low expression levels observed at 9 o’clock (A). The ratio of gene expression levels between evening (ZT13) and morning (ZT1) for fish raised under a normal LD cycle or under LL is shown in (B). In contrast to the observed circadian regulation under LD conditions, under LL conditions, expression levels remain continuously elevated not displaying any circadian fluctuation (B, C). (D) A reversal of the light cycle is reflected in a corresponding reversal of b-wave recovery. The comparison of b-wave recovery of LD and DL larvae recorded at the same time in the morning clearly indicates that immediately before darkness, b-wave recovery rates are reduced. Data are presented as mean ± sem (n = 16 larvae raised in LD; n = 9 larvae raised in DL) of three independent experiments. t-tests and nonparametric tests were performed by GraphPad Prism version 8. Plots with individual data points were provided in metadata from DRYAD. p = 0.001 at 500 ms interstimulus interval (isi); p = 0.0019 at 1000 ms isi; p = 0.0221 at 2000 ms isi; p = 0.0009 at 3000 ms isi; p = 0.0022 at 5000 ms isi. *p<0.05; **p<0.01; ***p≤0.001. (E) No changes in b-wave recovery between morning and evening can be observed under constant light conditions (LL). Data are presented as mean ± sem (n = 15 in the morning; n = 12 in the evening) of three independent experiments. t-tests and nonparametric tests were performed by GraphPad Prism version 8. p = 0.0107 at 500 ms isi; *p<0.05. Metadata can be downloaded from DRYAD.
|
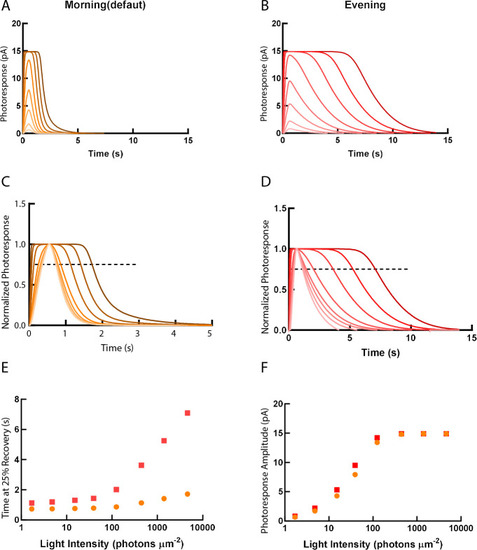
Simulations of single cone photoresponse in the morning (default) (A) and in the evening (B). 500 ms flash stimuli were delivered at time = 0 s. The flash intensities are 1.7, 4.8, 15.2, 39.4, 125, 444, 1406 and 4630 photons µm-2 (Invergo et al., 2014). (C) & (D) depict response curves normalized to the amplitudes at each light intensity. The dotted line represents 25% recovery of the photoresponse. Response duration for 25% recovery (E) and photoresponse amplitude (F) are plotted as a function of logarithmically increasing stimulus intensities.
|