
FIGURE
Fig. 4
- ID
- ZDB-FIG-211011-27
- Publication
- Ellingsen et al., 2021 - The zebrafish cationic amino acid transporter/glycoprotein-associated family: sequence and spatiotemporal distribution during development of the transport system b0,+ (slc3a1/slc7a9)
- Other Figures
- All Figure Page
- Back to All Figure Page
Fig. 4
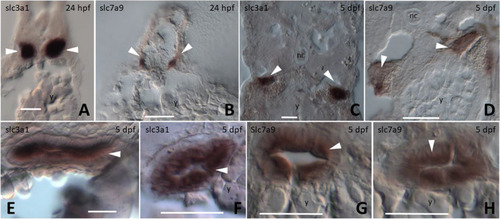
Images of cryo cross-sections from whole-mount in situ hybridization for the genes |
Expression Data
| Genes: | |
|---|---|
| Fish: | |
| Anatomical Terms: | |
| Stage Range: | Prim-5 to Day 5 |
Expression Detail
Antibody Labeling
Phenotype Data
Phenotype Detail
Acknowledgments
This image is the copyrighted work of the attributed author or publisher, and
ZFIN has permission only to display this image to its users.
Additional permissions should be obtained from the applicable author or publisher of the image.
Full text @ Fish Physiol. Biochem.