(A) Three-dimensional appearance (lateral view) of the zebrafish Slc7a9(b0,+AT)-Slc3a1(rBAT) complex bound to arginine in the hetero-2–2-mer (i.e., heterotetramer made of 2 heterodimers) form and (B) snapshot of the putative disulfide bridge linking covalently one of the two heterodimers (i.e., the heterodimer made of chain C, Slc3a1 and chain D, Slc7a9). The model was built using Protein Data Bank Acc. No. 6li9.1 as a template. Cysteine residues only are highlighted (yellow). A, chain A; B, chain B; C, chain C; D, chain D. Chains A and C refer to zebrafish Slc3a1; chains B and D refer to zebrafish Slc7a9. C104, cysteine residue C104 on chain C, Slc3a1; C150, cysteine residue C150 on chain D, Slc7a9

Evolutionary relationships of taxa for Slc3a1 and Slc7a9. The evolutionary history was inferred using the Neighbor-Joining method (Saitou and Nei 1987). An optimal tree with sum of branch length = 1.67110532 is shown. The percentage of replicate trees in which the associated taxa clustered together in the bootstrap test (1000 replicates) are shown next to the branches (Felsenstein 1985). The tree is drawn to scale, with branch lengths in the same units as those of the evolutionary distances used to infer the phylogenetic tree. The evolutionary distances were computed using the Poisson correction method (Zuckerkandl and Pauling 1965) and are in the units of the number of amino acid substitutions per site. The analysis involved 10 amino acid sequences. All positions containing gaps and missing data were eliminated. There were a total of 599 positions for Slc3a1 (A) and 471 positions for Slc7a9 (B) in the final dataset. Evolutionary analyses were conducted in MEGA7 (Kumar et al. 2016)

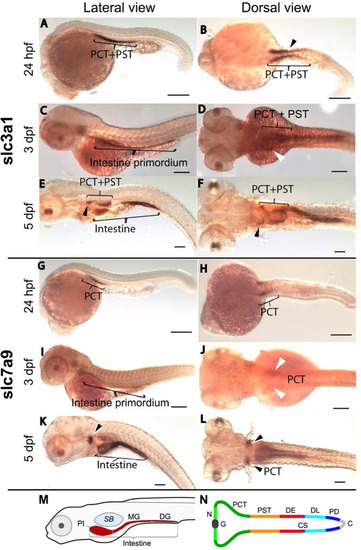
Spatiotemporal distribution of rBAT/slc3a1 and b0,+AT/slc7a9. Whole-mount in situ hybridization of wild-type embryos. (A) Lateral view shows expression of slc3a1 in proximal convoluted tubule (PCT) and proximal straight tubule (PST) segments of the nephron at 24 hpf. (B) Dorsal view shows two parallel stripes of slc3a1 expression at 24 hpf in the pronephros-spanning regions of PCT and PST. (C) Lateral view shows slc3a1 expression in intestinal primordium at 3 dpf. (D)slc3a1 expression at 3 dpf is also observed in the PCT and PST in the dorsal view. (EF)slc3a1 expression in the intestine, PCT, and PST at 5 dpf. (G) Lateral view and (H) dorsal view show the slc7a9 expression only in the PCT at 24 hpf. At 3 dpf, slc7a9 expression is seen in the intestinal primordium (I) and PCT (J). At 5 dpf, slc7a9 expression is seen in the PCT (K-L) and intestine (K–L). Arrowhead in B indicates putative region between PCT and PST. Arrowheads in D, E, F, J, K, and L indicate PCT expression domains (scale bar: 100 µm). M Schematic lateral view of primordial intestine at 5 dpf; with proximal intestine (PI), midgut (MG) and distal gut (DG). SB, swim bladder. N Schematic dorsal view of nephrons with segments indicated: glomerolus (G), neck (N), distal early (DE), corpuscle of Stannius (CS), distal late (DL), and pronephric duct (PD), cloaca (C) (modified from Wingert et al. 2007). Abbreviations: hpf, hours post fertilization; dpf, days post fertilization

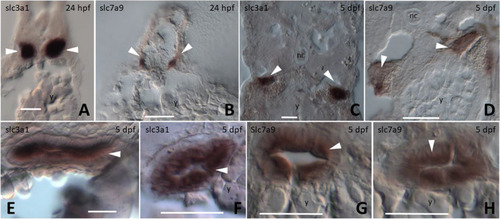
Images of cryo cross-sections from whole-mount in situ hybridization for the genes slc3a1 and slc7a9. (A)slc3a1 and (B)slc7a9 expression in two distinct nephrons (white arrowheads) at 24 hpf. (C)slc3a1 and (D)slc7a9 expression in two distinct nephrons (white arrowheads) at 5 dpf. (E–F)slc3a1 and (G-H)slc7a9 intestinal cross-sections reveal the localization of expression in enterocytes at 5 dpf (white arrowheads). Scale bar: 20 µm. All sections were dorsal to the top and ventral to the bottom. Scale bar: 20 µm. Abbreviations: nc, notochord; y, yolk; hpf, hours post fertilization; dpf, days post fertilization

ZFIN is incorporating published figure images and captions as part of an ongoing project. Figures from some publications have not yet been curated, or are not available for display because of copyright restrictions.

Acknowledgments
This image is the copyrighted work of the attributed author or publisher, and ZFIN has permission only to display this image to its users. Additional permissions should be obtained from the applicable author or publisher of the image. Full text @ Fish Physiol. Biochem.