
Figure 7
- ID
- ZDB-FIG-211009-23
- Publication
- Pancholi et al., 2021 - RNA polymerase II clusters form in line with surface condensation on regulatory chromatin
- Other Figures
- All Figure Page
- Back to All Figure Page
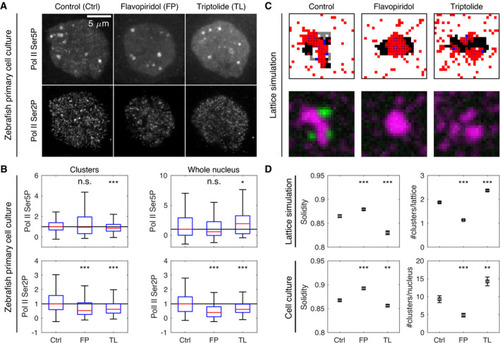
Representative micrographs showing Pol II Ser5P and Pol II Ser2P in primary cell cultures obtained from zebrafish embryos and treated for 30 min with control media (Ctrl), flavopiridol (FP, 1 μM), or triptolide (TL, 500 nM). Cell cultures were fixed at the end of treatment, labeled by immunofluorescence, and microscopy images were acquired by instant‐SIM. Shown are maximum‐intensity intensity projections, same color scaling used across conditions. Pol II Ser5P and Pol II Ser2P intensities at Pol II Ser5P clusters and throughout entire nuclei, standard boxplots. *** indicates Examples of lattice configurations obtained from simulations with modifications that mimic inhibitor treatments. For flavopiridol treatment, no gray regions were assigned. For triptolide, no gray regions were assigned, the Pol Ser5P self‐affinity ( Cluster solidity and the number of clusters obtained from lattice simulations and microscopy images of cell cultures, mean±SEM. Quantification was based on synthetic microscopy images, |