
Figure 2
- ID
- ZDB-FIG-211009-17
- Publication
- Pancholi et al., 2021 - RNA polymerase II clusters form in line with surface condensation on regulatory chromatin
- Other Figures
- All Figure Page
- Back to All Figure Page
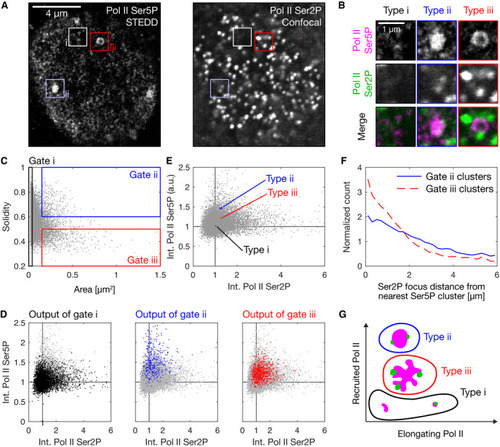
Representative nuclear mid‐section obtained by STEDD super‐resolution microscopy from a fixed sphere‐stage zebrafish embryo. Pol II Ser5P intensity distributions were obtained by STEDD microscopy, Pol II Ser2P intensity distributions by regular confocal microscopy from the same focal plane. Pol II Ser5P clusters with typical morphologies i–iii are marked. Detail views of the marked clusters, representing the typical morphologies i–iii. Area and solidity of individual clusters, with gate regions for the typical morphologies i–iii. Clusters were segmented based on Pol II Ser5P intensity, data obtained from a total of 52 mid‐nuclear sections from two different samples. The Pol II Ser5P and Pol II Ser2P intensities (mean intensity across all pixels inside a given cluster's segmentation mask) of the clusters in the gates i–iii are plotted in color over the entire ungated cluster population (light gray). Mean Pol II Ser5P and Pol II Ser2P intensities were scaled by the median value for each nucleus, then pooled. The median of the Pol II Ser5P and Pol II Ser2P levels of the gated clusters in panel D is plotted over the ungated population of clusters. Each cluster type is plotted with 95% bootstrapped confidence intervals in Pol II Ser5P and Pol II Ser2P direction (10,000 resamples). Analysis of the placement of Pol II Ser2P spots relative to Pol II Ser5P clusters of type ii or type iii (spots segmented based on Pol II Ser2P channel). Lines represent histograms of the distances to the nearest surface of a Pol II Ser5P cluster. The Euclidean metric was used to calculate distance of Ser2P foci gated pixels from nearest cluster. To display relative enrichment against random placement, histogram bin counts are normalized by counts for ungated pixel distances, then scaled by the mean across bins. Sketch of apparent morphology types of Pol II Ser5P clusters, placed by their levels of elongating and recruited Pol II. |