
Figure 6
- ID
- ZDB-FIG-211009-22
- Publication
- Pancholi et al., 2021 - RNA polymerase II clusters form in line with surface condensation on regulatory chromatin
- Other Figures
- All Figure Page
- Back to All Figure Page
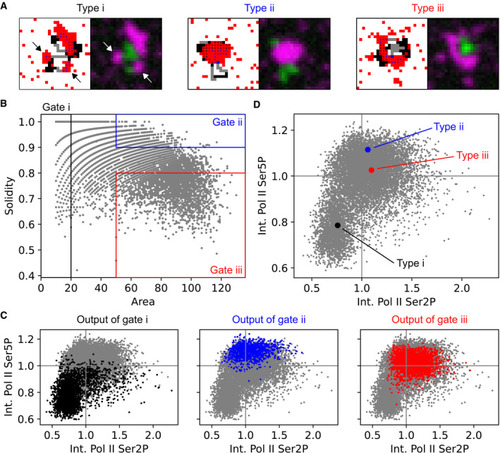
Example lattice configurations for all three cluster morphology cluster types (i–iii) are shown as lattice simulation output and the corresponding synthetic microscopy images. Area and solidity of individual clusters, with gate regions for the typical morphologies i–iii. Clusters were segmented based on Pol II Ser5P intensity (total 11,248 clusters). For each simulation, four chains with regions of randomly assigned length of The Pol II Ser5P and Pol II Ser2P intensities (mean intensity across all pixels inside a given cluster's segmentation mask) of the clusters in gates i–iii (color), ungated cluster population in gray. Intensities were scaled by the population median. Pol II Ser5P and Pol II Ser2P levels of the gated clusters in panel (C) plotted over the ungated population of clusters, median with 95% bootstrap confidence interval. For all types (i–iii), the confidence interval is hidden by the median data point. |