
FIGURE 5
- ID
- ZDB-FIG-211007-39
- Publication
- Qiao et al., 2021 - Alteration and the Function of Intestinal Microbiota in High-Fat-Diet- or Genetics-Induced Lipid Accumulation
- Other Figures
- All Figure Page
- Back to All Figure Page
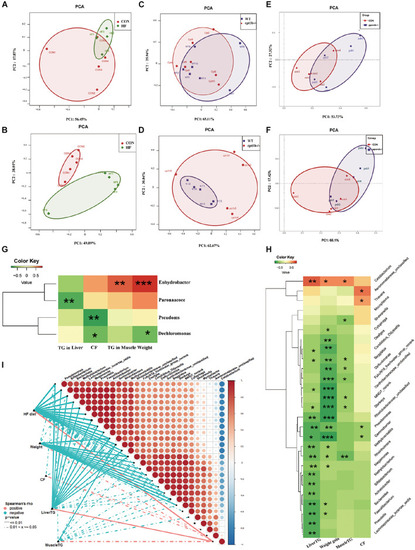
Comparison of gut microbiota composition among different dietary groups and different genotypes on same diets. (A) Principal components analysis (PCA) scores plot of dietary groups (CON and HF) based on 16S rRNA genes (n = 5 per group). (B) PCA scores plot of dietary groups (CON and HF) based on 16S rRNA (n = 5 per group). (C) PCA scores plot of WT and cpt1b–/– zebrafish based on 16S rRNA genes (n = 5 per group). (D) PCA scores plot of WT and cpt1b–/– zebrafish based on 16S rRNA (n = 5 per group). (E) PCA scores plot of WT and pparab–/– zebrafish based on 16S rRNA genes (n = 5 per group). (F) PCA scores plot of WT and pparab–/– zebrafish based on 16S rRNA (n = 5 per group). (G,H) Heatmap illustrates Spearman’s correlation between microbial genus and lipid overaccumulation traits measured between control and high-fat diet group based on (G) total microbial analysis and (H) active microbial analysis. (I) Correlation between abundance of microbial genus and lipid overaccumulation traits in HF groups based on active microbial analysis. *p < 0.05, **p < 0.01, ***p < 0.001. |