
FIGURE 1
- ID
- ZDB-FIG-211007-35
- Publication
- Qiao et al., 2021 - Alteration and the Function of Intestinal Microbiota in High-Fat-Diet- or Genetics-Induced Lipid Accumulation
- Other Figures
- All Figure Page
- Back to All Figure Page
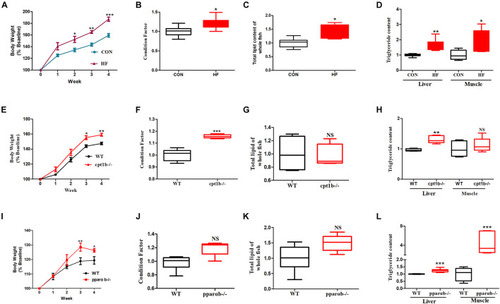
Phenotypes of zebrafish with different genotypes or fed on different diets. (A) Growth curve established using average bodyweight of two dietary groups (CON and HF) every week for 4 weeks (n = 3 per group). (B) Condition factor (CF) of two dietary groups (n = 15 per group). (C) Total lipid of whole fish of two dietary groups (n = 15 per group). (D) Triglyceride contents of liver and muscle of two groups (n = 8 per group). (E) Growth curve established using average bodyweight of WT and cpt1b–/– zebrafish every week for 4 weeks (n = 3 per group). (F) Condition factor of WT and cpt1b–/– zebrafish (n = 15 per group). (G) Total lipid of whole fish of WT and cpt1b–/– zebrafish (n = 15 per group). (H) Triglyceride contents in liver and muscle of WT and cpt1b–/– zebrafish (n = 8 per group). (I) Growth curve established using average bodyweight of WT and pparab–/– zebrafish every week for 4 weeks (n = 3 per group). (J) Condition factor of WT and pparab–/– zebrafish (n = 15 per group). (K) Total lipid of whole fish of WT and pparab–/– zebrafish (n = 15 per group). (L) Triglyceride contents in liver and muscle of WT and pparab–/– zebrafish (n = 8 per group). All data are normalized to control group (100%) and presented as means ± SEM. Significance difference was analyzed by Student’s t-test (*p < 0.05, **p < 0.01, ***p < 0.001). |