
Figure 1.
- ID
- ZDB-FIG-210927-31
- Publication
- Song et al., 2021 - Cost-precision trade-off relation determines the optimal morphogen gradient for accurate biological pattern formation
- Other Figures
- All Figure Page
- Back to All Figure Page
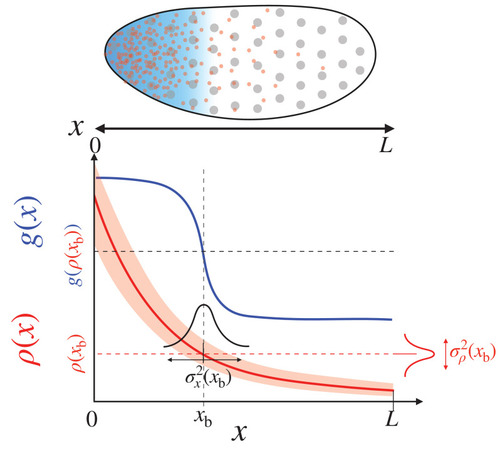
(Top) The specification of the anterior region of the fruit fly embryo. The uniformly distributed nuclei (gray circles) are subjected to different concentrations of the morphogen (red dots) in the local environment, which leads to the anterior expression of the target gene (blue shade). (Bottom) The red and blue lines respectively depict the morphogen profile, , and the target gene expression, , which together specify cell fate. The squared positional error at the boundary , , is defined as the product between the variance of the morphogen concentration, , and the squared inverse slope of the morphogen profile, .
|