
|
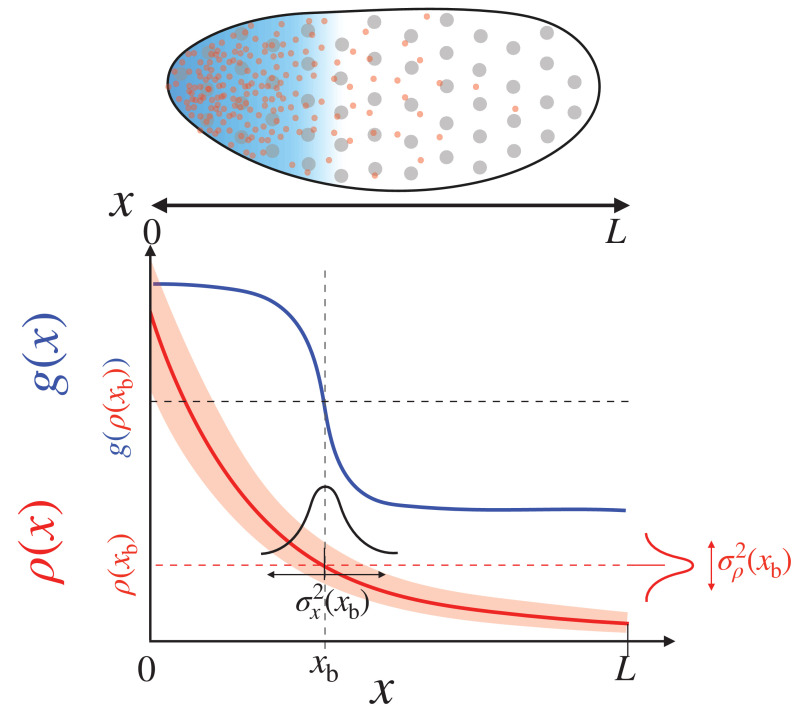
Figure 1.
(Top) The specification of the anterior region of the fruit fly embryo. The uniformly distributed nuclei (gray circles) are subjected to different concentrations of the morphogen (red dots) in the local environment, which leads to the anterior expression of the target gene (blue shade). (Bottom) The red and blue lines respectively depict the morphogen profile, , and the target gene expression, , which together specify cell fate. The squared positional error at the boundary , , is defined as the product between the variance of the morphogen concentration, , and the squared inverse slope of the morphogen profile, .
Positional information transfer by the morphogen gradient.