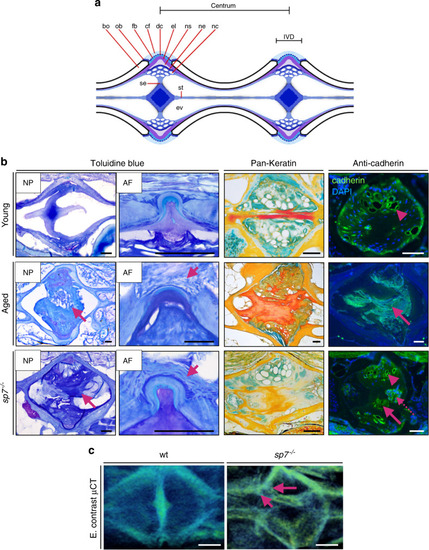
IVDD histopathology underlying 3D disc changes in zebrafish. a Schematic of the vertebral segments of the zebrafish. IVDD histopathology underlying 3D disc changes in zebrafish. The centrum and IVD regions are annotated. bo, bone; cf, collagen type I fiber bundles; dc, dense collagen type I matrix; el, elastin; ev, extracellular vacuole; fb, fibroblasts; nc, notochord cells, vacuolated cells and notochord epithelial cells attached to the notochord sheath; ne, notochord epithelium; ns, notochord sheath; ob, osteoblasts; se, septum; st, notochord strand. b Toluidine blue, pankeratin and pan cadherin immunostaining of young (1 y), aged (3 y), and sp7−/− (1 y) discs. Toluidine blue of a middle section of the disc showing the NP in young, aged, and sp7−/− discs (n = 3 per group, serial sections were analyzed). Note the fibrous and disorganized NP in aged and sp7−/− (magenta arrows) discs. Higher magnification, with a focus on the AF, is shown on the right. Note collagen bundle fibers disrupted in the aged AF and loose organization in the sp7−/− disc (magenta arrows). Pankeratin showing bone (yellow), keratin (orange), and glycosaminoglycans (green). Note the accumulation of keratin in aged discs and dehydration (weak stain for glycosaminoglycans) in aged and sp7−/− discs. Immunostaining for pan cadherin showing the loss of cellularity in aged discs (arrow) and disorganized NPs in sp7−/− discs, with vacuolated cells (pink arrowhead), acellular regions (pink arrow), and cellular agglomerates (pink dashed arrow) (n = 3 per group, ≥3 sections analyzed). Scale bars = 50 μm. c 3D volumetric rendering from enhanced (E) contrast μCT images of wt (1 y) and sp7−/− (1 y) zebrafish. Note fibrous tissue organization in sp7−/− zebrafish. Arrows point to an abnormal notochord sheath layer. Scale bars = 50 μm
|
