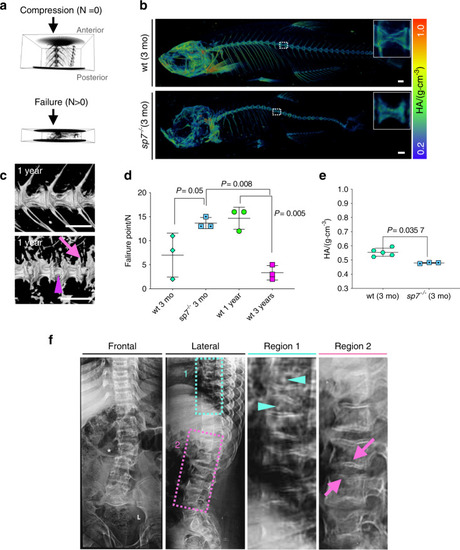
Altered vertebral column biomechanics in aged and sp7−/− zebrafish show increased bone fragility. a Intact vertebral column motion segments (composed of three vertebrae surrounded by trunk musculature) were placed in a material testing stage (MTS), followed by μCT imaging at increasing compression forces. An example of vertebral column segments before compression (N = 0) and after failure (N > 0) is shown. Anterior and posterior orientations of the zebrafish are annotated. b 3D volumetric rendering from μCT images of 3-month-old wt and sp7−/− zebrafish color coded for tissue mineral density (TMD). The dashed box shows the magnified region presented on the right of the panel. Scale bars = 500 μm. c Volumetric rendering from μCT images of 1-year-old wt and sp7−/− zebrafish. Note IVD calcification (arrowhead) and abnormal shapes of the centra (arrow) in sp7−/− zebrafish. Scale bars = 500 μm. d Failure points during compressive forces of 3-month-old (3 mo) sp7−/− zebrafish, wt zebrafish siblings, 1-year-old wt siblings, and 3-year-old wt siblings (n = 3 per group). One-way ANOVA and post hoc Holm–Sidak’s multiple comparisons test were used; data are the mean and SD. P values are indicated. The graph was generated in Prism 8. Scale bars = 500 μm. e TMD of 3-month-old (3 mo) wt and sp7−/− zebrafish (wt n = 5 (3 males +2 females), sp7−/− zebrafish n = 3 (2 males + 1 female)). Standard fish lengths: wt = 2.43 cm (0.2 SD); sp7−/− = 2.17 (0.4 SD). Nonparametric, two-tailed, Mann–Whitney test; data are the mean and SD. P values are indicated. f Radiograph of a 16-year-old male with a frameshift mutation in SP7 (c.1052delA). Frontal and lateral images are displayed. Regions 1 and 2 are magnified and displayed on the right. Lumbar spinal curvature (asterisk), biconcave vertebrae (pink arrows), the spread of IVD, and signs of IVD calcification (cyan arrowhead) are shown
|
