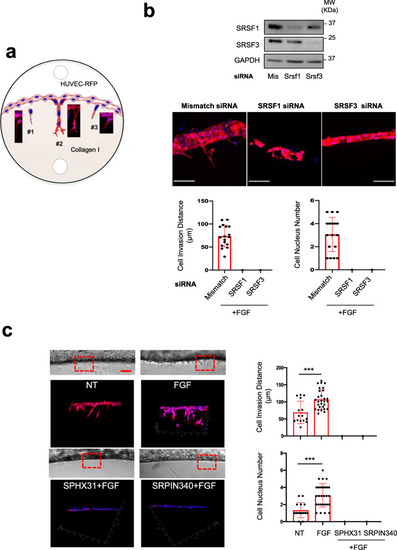
SRSF1/SRSF3 knockdown and SRPK1 inhibitors abrogate HUVEC-RFP invasion and sprouting in 3D collagen matrix. a Schematic representation of 3 different types of endothelial cell HUVEC-RFP behavior. #1: aborted endothelial cell sprouting, endothelial cells invade the collagen matrix without being followed by stalk cells; #2: capillary formation, complete process of endothelial cell invasion and sprouting. Filopodia projecting from the tip cells are observed; #3 early step of endothelial cell responses. For quantification, cell responses were scored according to these 3 types of cell behavior. b HUVEC-RFP were transfected for 48 h with control siRNA (mismatch) or a 50:50 mixture of two different SRSF1 (SRSF1) or SRSF3 (SRSF3) siRNAs before being analyzed in 3D invasion assay. Upper panel: immunoblots showing the efficient knockdown of SRSF1 or SRSF3 in HUVEC-RFP. GAPDH was used as a loading control. Lower panels: mosaic of confocal images covering around 300 μm of matrices border for different HUVEC-RFP post-transfection with indicated siRNA. HUVEC-RFP cells are in red and nuclei in blue. Scale bar = 100μm. Bar charts represent the quantifications of the invading distance of HUVEC-RFP within the 3D collagen matrices and the number of invading cells (nuclei) per 300 μm of gel border. Each black dot indicates one invading sprout. c HUVEC-RFP cells were treated or not (NT) with 3nM FGF-2 for 24 h in the presence or absence of 5μM SPHINX31 or 10μM SRPIN340 before performing 3D invasion assay. Left top panels: transmission light microscopy images showing invasive capacities of HUVEC-RFP within the 3D collagen gels. Left bottom panels: mosaic of confocal images covering around 300 μm of matrices border. HUVEC-RFP cells are in red and nuclei in blue. Scale bar = 100μm. Right panel: Bar charts represent the quantification of the invading distance of HUVEC- RFP within the 3D collagen matrices (top) and the number of invading cells (nuclei) per 300 μm of gel border (bottom). Each black dot indicates one invading sprout. b, c Graphs represent mean values ± SD of three independent experiments. Unpaired t test, ***p<0.001
|

