
Figure 8
- ID
- ZDB-FIG-210902-256
- Publication
- Kurnia et al., 2021 - TCMacro: A Simple and Robust ImageJ-Based Method for Automated Measurement of Tail Coiling Activity in Zebrafish
- Other Figures
- All Figure Page
- Back to All Figure Page
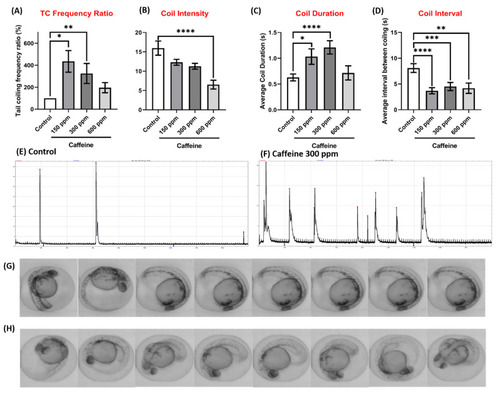
Comparison of tail coiling activity for zebrafish embryos at 24 hpf for control and caffeine exposure. (A) Quantitative comparison of tail coiling frequency ratio, (B) average intensity, (C) coil duration and (D) coil interval of zebrafish embryos treated with different doses of caffeine. The representative tail coiling peak obtained from either (E) control or (F) 300 ppm caffeine exposed zebrafish. Time-lapse comparison showing tail coiling movement in zebrafish embryo after receiving either (G) 0 or (H) 300 ppm caffeine. Statistical validation is carried out using Kruskal-Wallis test. Data are presented as Mean ± SEM, n = 40 (* p < 0.05, ** p < 0.01, *** p < 0.001, **** p < 0.0001, ns p > 0.05). |