
FIGURE
Figure 6
- ID
- ZDB-FIG-210902-254
- Publication
- Kurnia et al., 2021 - TCMacro: A Simple and Robust ImageJ-Based Method for Automated Measurement of Tail Coiling Activity in Zebrafish
- Other Figures
- All Figure Page
- Back to All Figure Page
Figure 6
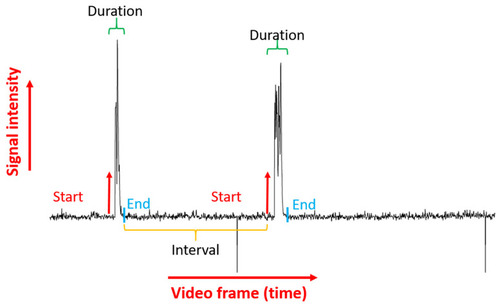
Start and end threshold set for tail coiling occurrence duration and the interval between tail coiling occurrence. Some important endpoints such as tail coiling interval and tail coiling duration can also be extracted from the raw signal intensity over time data. |
Expression Data
Expression Detail
Antibody Labeling
Phenotype Data
Phenotype Detail
Acknowledgments
This image is the copyrighted work of the attributed author or publisher, and
ZFIN has permission only to display this image to its users.
Additional permissions should be obtained from the applicable author or publisher of the image.
Full text @ Biomolecules