|
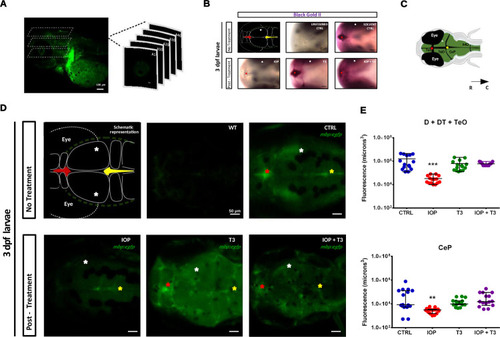
IOP and T3 rescue treatment in <italic toggle='yes'>mbp</italic>:<italic toggle='yes'>egfp</italic> transgenic zebrafish larvae at 3 dpf.(A) Lateral scan of the head using confocal microscopy and generating multiple 3D optical sections; scale bar: 100 μm. (B) Representative photomicrograph of zebrafish larvae with dorsal view and R-C orientation, whole-mount Black-Gold II staining in D, DT and at 3 dpf (wild-type, CTRL, IOP, T3 and IOP + T3). scale bar: 50 μm. (C) Schematic drawing with dorsal view of the head; the asterisks represent signal in the habenula and between the telencephalon (Tel) and tectum opticum (TeO) (red); signal within the TeO (white) and signal in the dorsal Tectum and between TeO and cerebellar plate (CeP) (yellow). The black arrow represents the orientation of the larvae, rostral-caudal (R-C). (D) The images are the representation of the maximum intensity projection of the entire set of Z-stacks: uninjected CTRL (WT), CTRL, larvae treated with IOP 0.5 μM, T3 10 nM or IOP 0.5 μM + T3 10 nM; scale bar: 50 μm. (E) Graphs depicting the volume of the myelinated area in voxels, Data are shown as individual values and mean ± SEM (approximately n = 15 larvae/group). Statistical analysis was performed with one-way ANOVA coupled with Tukey’s multiple comparison test with respect to the control group. **p< 0.01 and ***p< 0.001.
|